

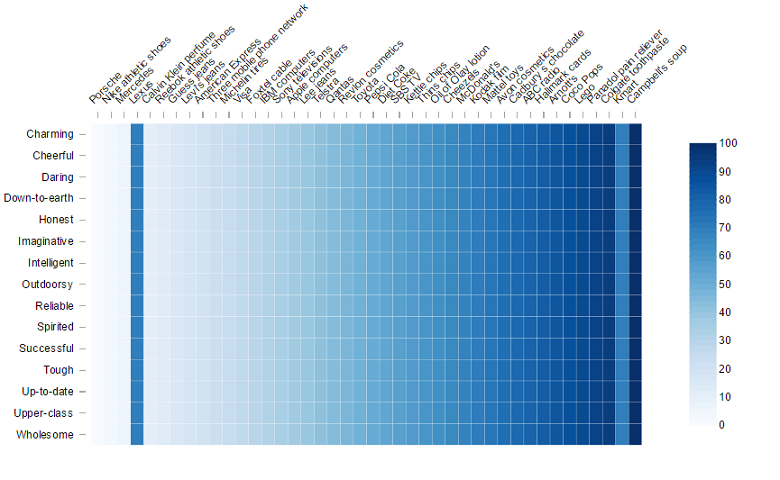
Heatmaps are cool. Most people like them. They are so much prettier than a bar chart. The one below, created in Making your data hot: heatmaps for the display of large tables, is both nice to look at and informative. However, basic psychology tells us that these heatmaps are easy to misread.
The problem is that when we perceive shading, our brains tend to think in terms of relativities. That is, it notices sharp contrasts between adjacent bits of an image. However, we are poor at comparing shading in non-adjacent regions of a visualization.
If you have studied any introductory psychology, there is a good chance you have come across this perceptual illusion before. It is sometimes called the checker shadow illusion.
In the heatmap below I have used some made up data to illustrate this problem. Lexus, fourth from the left, has the same color as Kmart, which is second from the right. However, even though I have told you that these two colors are the same, your brain tells you something different. Your brain tells you that the Lexus color is darker than the Kmart color. Even if you hover your mouse over each, confirming that they are both 70, your brain still can’t break the illusion.
The only way most people can accept that they are not being tricked is by taking screen prints lining everything up. I have saved you time by doing this for you below.
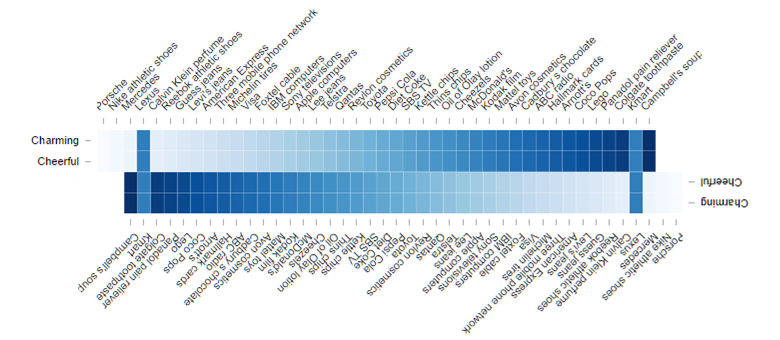
Of course, I could have tricked you with the screen print above, and if you click this link, you can inspect the underlying code and the data in Displayr.