The value equivalence line is a useful concept for setting pricing strategies in markets where products vary in terms of their overall levels of benefits (e.g., quality levels). This post explains how the value equivalence line can be used in conjunction with a conjoint simulator to portfolios, illustrated using a study of the US cell phone market.
Value maps and the VEL
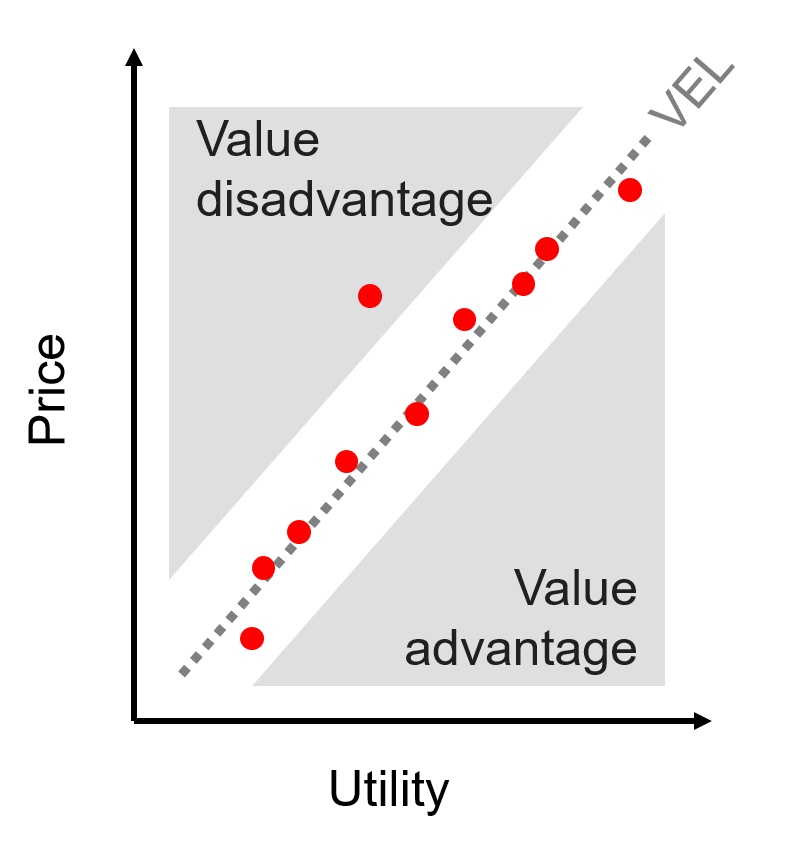
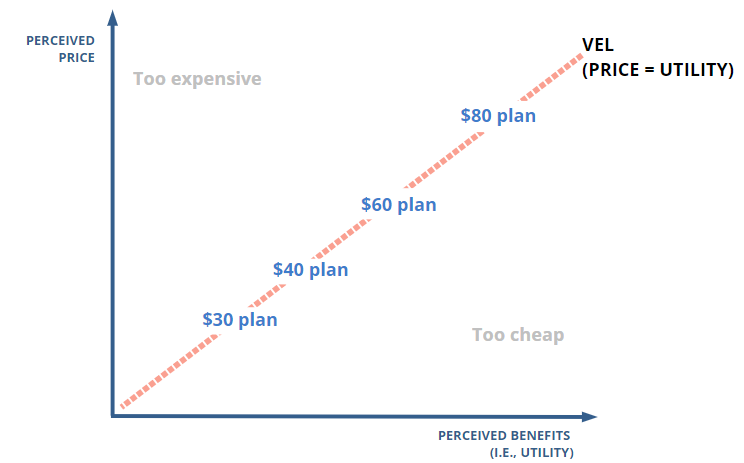
A value map plots products according to their price and their utility (i.e., a quantitative measure of the benefit that each of the products provides). In a stable market, you should expect to see products offering utility commensurate with their prices. We can draw a line on the value map which indicates when price and utility are in sync; this line is called the Value Equivalence Line (VEL), and products on that line are said to be of equivalent value (note here that the concept of value here includes that of price, rather than being a synonym for price). Products that are expensive relative to their utility appear above the VEL and are at a value disadvantage. Products below the VEL are at value advantage. Products in value advantage should grow in share over time, while products in value disadvantage should decline.
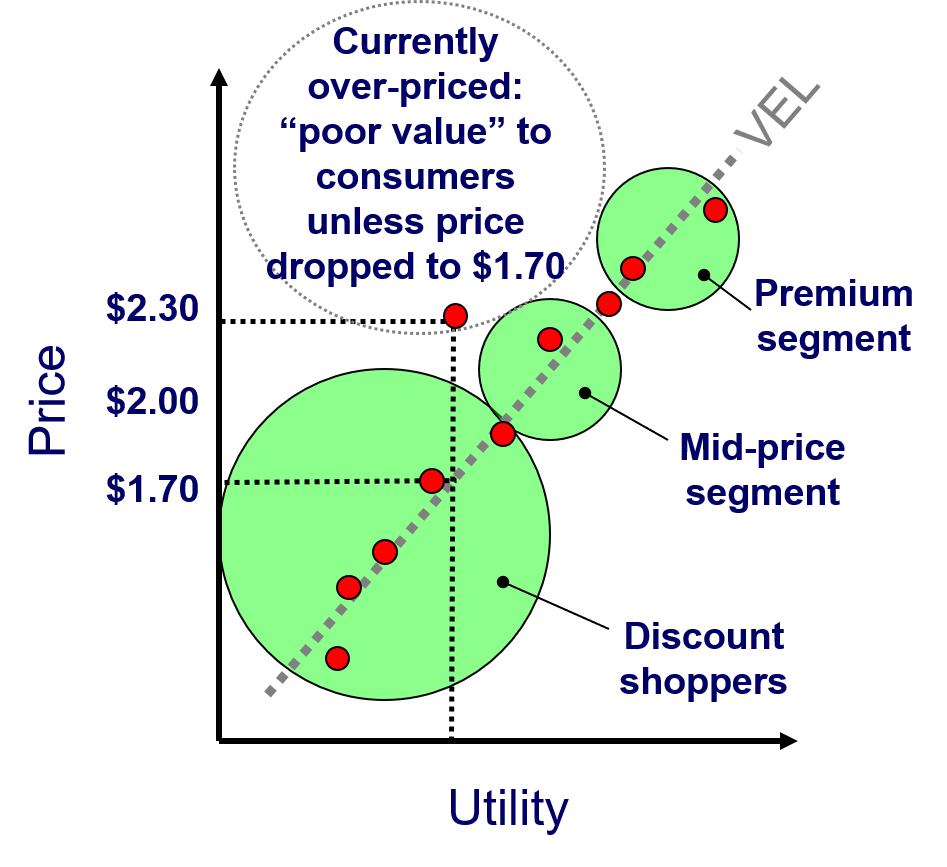
The concept of the VEL aligns to the concept of price segments, with products focused on discount shoppers being at the bottom left of the value map and the premium products at the top right.
Using conjoint simulators to identify products of equal value: worked example
Consider the problem of trying to design cell phone plans. Let’s say you want to offer a $30, $40, $60, and $80 plan. A good plan is one where each of these plans delivers benefits commensurate to its price point.
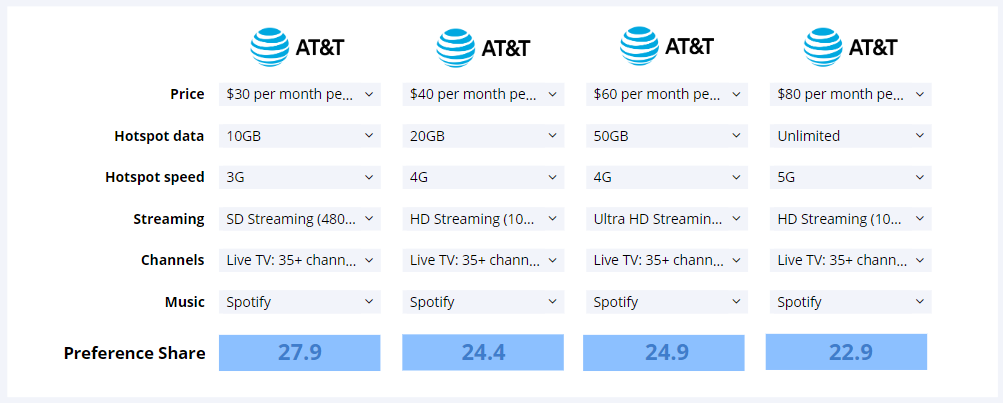
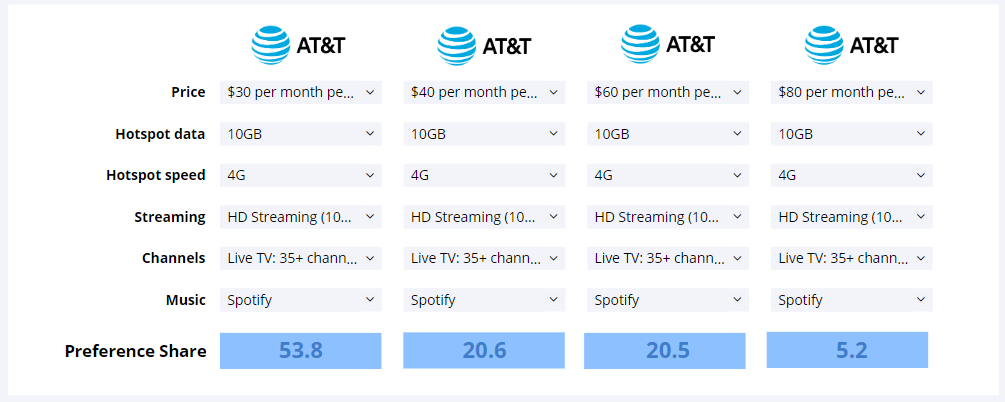
Using a simulator, we can create products with similar values by modifying their attributes so that they have similar shares. In the simulator output shown below, all the products are the same, and they only differ in price. Thus, the cheaper the plan, the more in value advantage. For this reason the cheapest plan, at $30 a month, has the highest share (if you are wondering why the model predicts anybody would prefer the higher alternatives, this is because when people make choices in questionnaires, just as in real life, they are a bit irrational/inconsistent).
Below, I’ve modified the features of the different plans so that their preferences are very similar, and thus, by definition, they offer similar levels of value, and so the resulting four-tiered pricing plan offers choices of different price points with their commensurate levels of benefit.