


The k-means clustering (also written k means clustering) algorithm is a cornerstone of modern data analysis, widely used for segmenting data into meaningful groups. In this article, we’ll provide a clear k-means clustering definition, explain how the algorithm k-means works step-by-step, and show you how to use it for market segmentation and other practical applications.
k-means clustering definition
The k-means clustering algorithm is an unsupervised machine learning technique that partitions data into K distinct clusters based on similarity. Each cluster is defined by its center (mean), and the algorithm iteratively assigns each data point to the nearest cluster center, updating centers until the solution converges
Required data for k-means cluster analysis
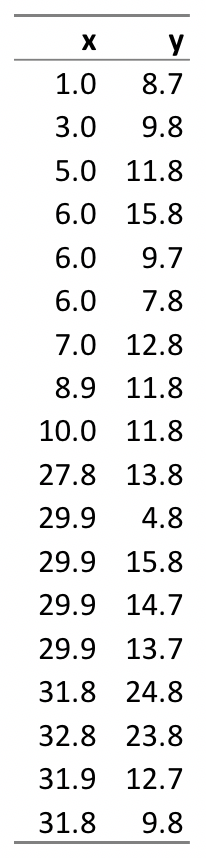
k-means cluster analysis is performed on a table of raw data, where each row represents an object and the columns represent quantitative characteristics of the objects. These quantitative characteristics are called clustering variables. For example, in the table below there are 18 objects, and there are two clustering variables, x, and y. In a real-world application, there will typically be many more objects and more variables. For example, in market segmentation, where k-means is used to find groups of consumers with similar needs, each object is a person and each variable is commonly a rating of how important various things are to consumers (e.g., quality, price, customer service, convenience).
How the k-means clustering algorithm works
Step 1: Specify the number of clusters (k). The first step in the algorithm k-means is to specify the number of clusters, which is referred to as k. Traditionally, researchers will conduct k-means multiple times, exploring different numbers of clusters (e.g., from 2 through 10).
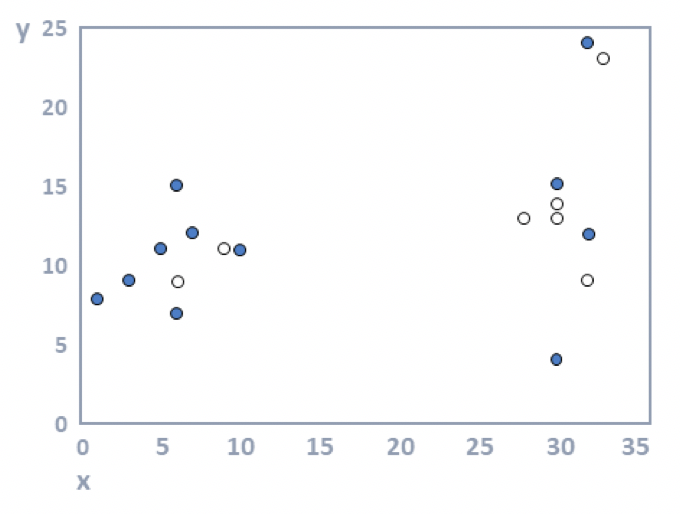
Step 2: Allocate objects to clusters. The most straightforward approach is to randomly assign objects to clusters, but there are many other approaches (e.g., using hierarchical clustering). The 18 objects have been represented by dots on a scatterplot, as seen in the diagram below, where x is shown by the horizontal position of each object and y by the vertical. The objects have been randomly assigned to the two clusters (k = 2), where one cluster is shown with filled dots and the other with unfilled dots.
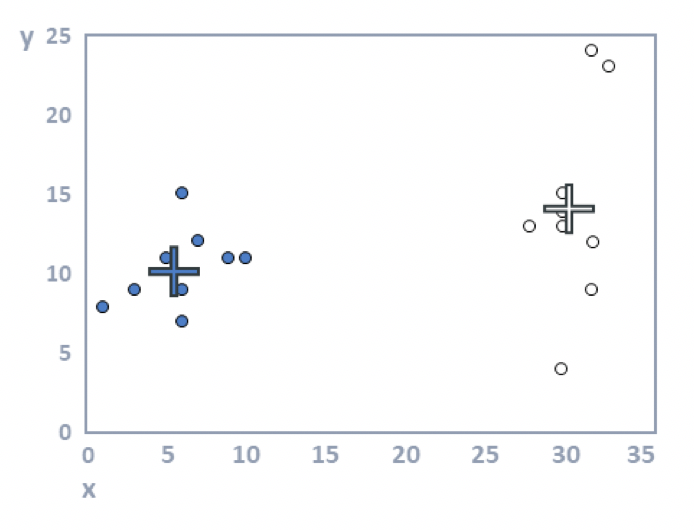
Step 3: Compute cluster means. For each cluster, the average value is computed for each of the variables. In the plot below, the average value of the filled dots for the variable represented by the horizontal position (x) of the dots is around 15; for the variable on the vertical dimension, it is around twelve. These two means are represented by the filled cross. Or, stated slightly differently: the filled cross is in the middle of the black dots. Similarly, the white cross is in the middle of the white dots. These crosses are variously referred to as the cluster centers, cluster means, and cluster medoids.
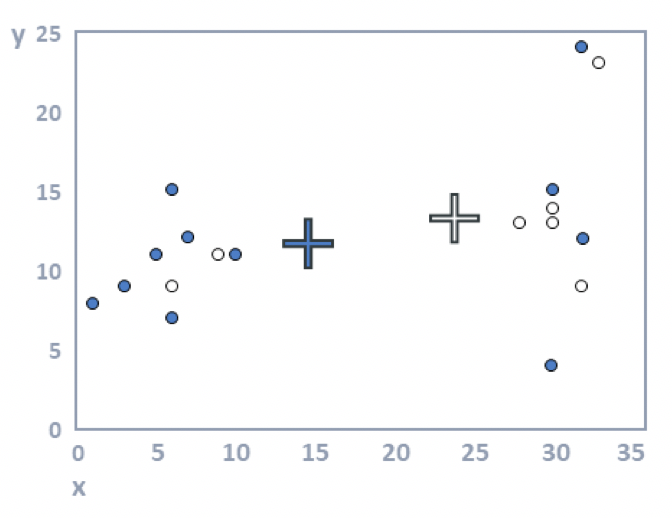
Step 4: Allocate each observation to the closest cluster center. In the plot above, some of the filled dots are closer to the white cross, and some of the white dots are closer to the black cross. When we reallocate the observations to the closest clusters, we get the plot below.
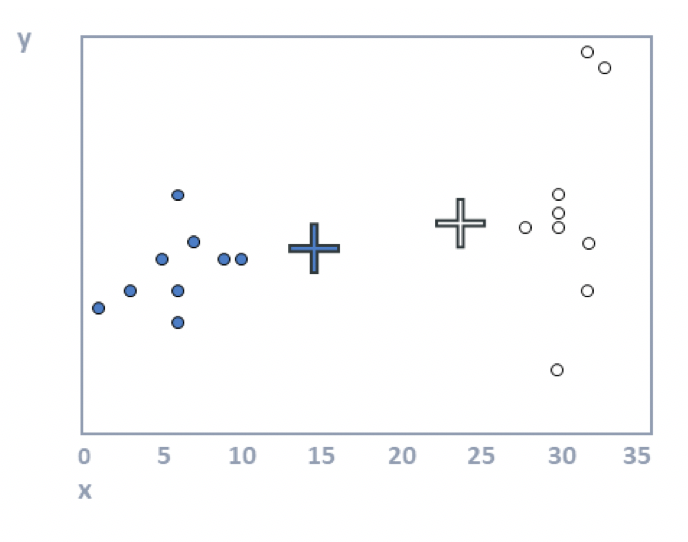
Step 5: Repeat steps 3 and 4 until the solution converges. Looking at the plot above, we can see that the crosses (the cluster means) are no longer accurate. The following plot shows that they have been recomputed using step 3. In this example, the cluster analysis has converged (i.e., reallocating observations and updating means cannot improve the solution). When you have more data, more iterations are typically required (i.e., steps 3 and 4 are repeated until no respondents change clusters).
The algorithm described above is known as the batch algorithm. Many other variants of k-means have been developed. Perhaps the most popular of these moves objects to a cluster one at a time, updating the mean each time.
Download your free DIY Market Segmentation ebook
The outputs from k-means cluster analysis
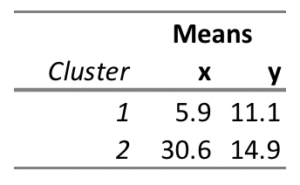
The main output from k-means cluster analysis is a table showing the mean values of each cluster on the clustering variables. The table of means produced from examining the data is shown below:
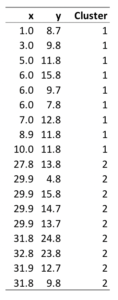
A second output shows which object has been classified into which cluster, as shown below. Other outputs include plots and diagnostics designed to assess how much variation exists within and between clusters.
k-means clustering in R and Python
R makes k-means clustering straightforward with the built-in kmeans() function. The basic syntax is as follows:
kmeans(x, centers, iter.max = 10, nstart = 1,

algorithm = c("Hartigan-Wong", "Lloyd", "Forgy", "MacQueen"),

trace = FALSE)- cluster
- centers
- tot.withinss (total within-cluster sum of squares)
Although it is relatively straightforward to run k-means clustering in R, it can be tricky to determine the appropriate k value. You can check out Displayr’s guide to working out the number of clusters for more information.
Download your free DIY Market Segmentation ebook
In Python (scikit-learn), the KMeans class follows the standard scikit-learn fit/predict pattern:
from sklearn.cluster import KMeans

kmeans = KMeans(n_clusters=3, random_state=42)
kmeans.fit(X)

kmeans.labels_            # Cluster assignment for each row
kmeans.cluster_centers_   # Coordinates of cluster centroids
kmeans.inertia_           # Total within-cluster sum of squares
As in R, you need to specify the number of clusters in advance. Use the elbow method — plotting inertia_ across a range of k values — to find the point where adding another cluster stops meaningfully reducing within-cluster variation.