


According to Nielsen’s Global Trust in Advertising Report, 83% of respondents said that they trust recommendations from family and friends more than any form of advertising. This makes word of mouth an extremely powerful marketing tool. The Net Promoter Score (NPS) is a customer feedback benchmark that measures how likely your customers are to recommend your brand or product. It’s one of the most widely used metrics in customer feedback surveys. Here’s what you need to know before getting started.

The Net Promoter Score (NPS)
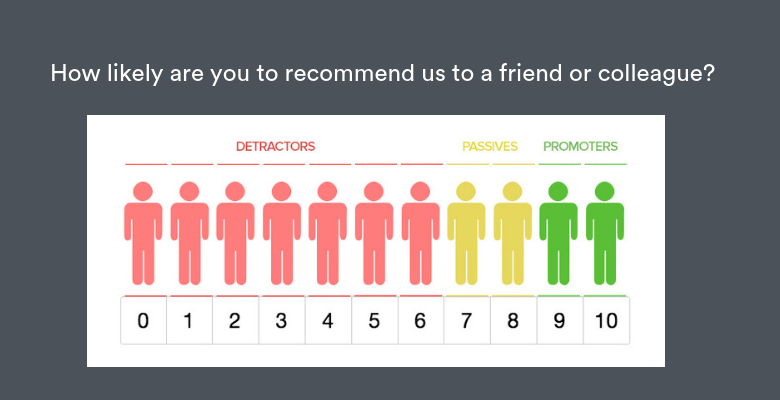
The Net Promoter Score is based on a single question: “On a scale of 0-10, how likely are you to recommend this brand/product/service to a friend or colleague?”
The score is then calculated by the following formula:
Percentage of Promoters – Percentage of Detractors
Where:
- Detractors: respondents who gave a score between 0-6
- Passives: respondents who gave a score between 7-8
- Promoters: respondents who gave a score between 9-10
For example, if 70% of your respondents are Promoters and 20% are Detractors, then your overall Net Promoter Score is 50% (70 – 20 = 50).
Promoters are loyal and highly satisfied customers who are likely to recommend your product. Passives are moderately satisfied but are vulnerable to switch to a competitor. Detractors are unsatisfied with your product and are most at risk of churn. The overall Net Promoter Score ranges from -100 to 100, and a number in the positives is generally considered to be adequate.
The Net Promoter Score is simple and well defined, making it a great metric to track over time. Just include the same question in your routine customer feedback survey, and see how your score varies. NPS is a great way to gauge customer loyalty, user engagement, and even overall satisfaction.
Try it yourself
Analyzing NPS is a breeze with Displayr. With our automated tools, you can categorize your respondents into Detractor, Passive, and Promoter categories with a click of a mouse and instantly calculate your Net Promoter Score. We also offer built-in statistical testing, which allows you to check whether your results are noteworthy. When you’re done analyzing your NPS data, you can use our beautiful and interactive data visualizations to present your results!
Click the button below for a free step-by-step tutorial.
