


Principal Components Analysis (PCA) is a technique for taking many variables and creating a new, smaller set of variables. These aim to capture as much of the variation in the data as possible. In this post, we show you how to save, access, and export the PCA results and output. For information on how to set up and run the PCA, see How to Do Principal Components Analysis in Displayr.
Principal Component Loadings
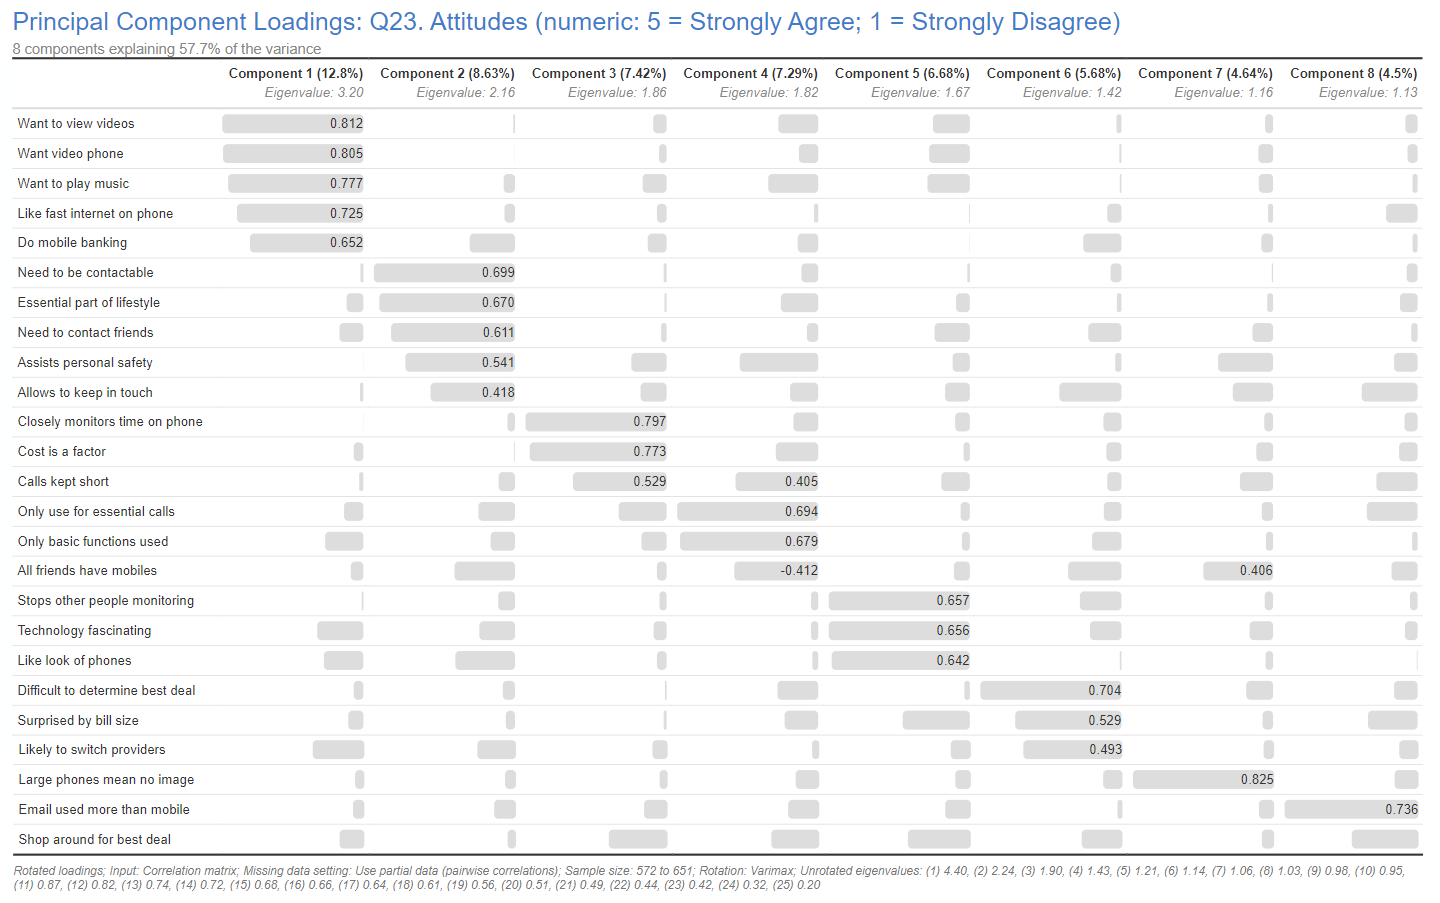
The default PCA output is the Principal Components Loadings table which shows one row for each of the original variables. From the same example used in How to Do Principal Components Analysis in Displayr, each of the 8 new variables or components identified by the PCA appears in the columns. The cells of the table show figures referred to as loadings.
These loadings represent the correlations between the new variables and the original variables. As correlations, they will always range between -1 and 1. A score towards 1 indicates a strong positive relationship, a score towards -1 indicates a strong negative relationship, and scores closer to 0 indicate weaker or non-existent relationships. The output omits smaller correlations. However, the bar remains to indicate their values. To display these values, deselect the Suppress small coefficients checkbox.
Saving Component Scores
To save a set of respondent level component score variables from the PCA output, select:
Insert > Dimension Reduction > Save Variable(s) > Components/Dimensions
This creates a set of variables for each component at the top of the Data Sets tree grouped together as a question called Scores from dim.reduce. These scores are standardized respondent level component scores with a mean of 0 and standard deviation of 1 across the entire sample. You can then rename the component variables based on the attributes to which they most closely correlate. To do this, select each of the component variables group under Scores from dim.reduce in the Data Sets tree, right-click, and select Rename.
The new variables are linked back to your PCA output. This means that if you change any of the input options and then calculate the PCA again, the scores will also update automatically based on the updated analysis. If you change the number of components in the analysis, you should delete the variables for the scores in the Data Sets tree and save a new set of scores.
As an alternative, you can also save the component score variables as follows:
1. From the Insert menu, select R > Numeric Variable
2. In the R CODE field, paste in the code here (where dim.reduce is the name of the output that you’ve previously created):
fitted(dim.reduce)
3. Click the Calculate button to run the code.
4. Allocate a Question Name and Label in GENERAL.
Exporting PCA Results
To export the Rotated Loadings table, select the PCA output and then from the menu select Export > Excel. Select Current Selection and then click the Export button. An Excel file containing the loadings table will be exported.
You can also generate an R output of the loadings table by selecting Insert > R Output (in the Analysis group) from the menus, then enter the following R code and click the Calculate button.
dim.reduce$rotated.loadings
This will generate an unsorted R table containing the loading coefficients which can also be exported to Excel. You can adjust the number of decimal places using the decimal options on the Appearance menu. Note that this is based on a PCA name dim.reduce which is the default PCA object name in Displayr. If you’ve renamed your PCA analysis, you’ll need to make the change in the code as well.
If you instead want to export the respondent level component scores, you can do so by creating a raw data table and then export this to Excel. To do this, from the menu select Insert > More > Tables > Raw Data. Next, select each of the component scores from the Variables drop-down list in the Object Inspector. Click the Calculate button to generate the output. This output can now be exported by selecting an option from the Export menu.
