


Data setup
Principal Components Analysis always views data numerically. This means that you need to be careful with the question Structure assigned to your variables to ensure the analysis views their numeric values. The variables in a PCA should be part of a Numeric, Numeric - Multi, or Binary - Multi question.
In most cases, you should set your variables up as Numeric or Numeric - Multi. The variables do not need to be grouped together.
You may or may not choose to normalize the input variables so that the variables have the same range and standard deviation. For example, if using attitudinal data, where the scales are arbitrary (e.g., a 5-point scale), you typically normalize the data so that it is not affected by the scale. But, when using non-attitudinal data (e.g., rainfall, sales, behavioral data, frequency of drinking cola brands) you usually don't normalize as the scale of the variables is meaningful.
Remember, they could come from different questions, but they should all be on the same scale (that is, don’t mix 5-po int scales with binary variables or 10-point scales). Binary - Multi is appropriate to use when the data are binary.
If your variables are not set up as Numeric, Numeric - Multi, or Binary - Multi, you can:
- Locate the variables in the Data Sets tree.
- (Optional) Make new copies of the variables by selecting them, and from the menu choosing Home > Duplicate.
- From the Object Inspector on the right side of the screen, change the Structure to either:
- Numeric, if there’s a single numeric variable,
- Numeric - Multi, if you have multiple numeric variables that are grouped together, or
- Binary - Multi, for binary variables.
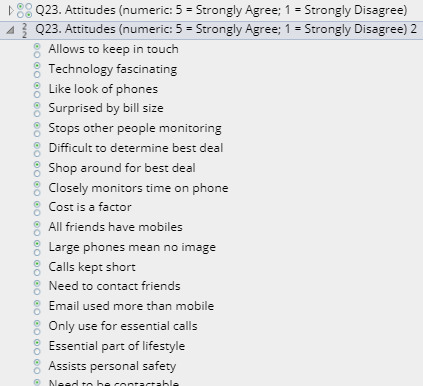
In this article, I am using an example of a 5-point scale (called “Q23. Attitudes”). We asked several statements about our respondents' mobile phone use. Originally, the variables were set up as a Nominal - Multi question, which is typically how looped scales like this will appear in Displayr. In my screenshot below, I made a copy of the question for use in the PCA, and then set the Structure to Numeric - Multi.
Creating the Principal Components Analysis
To create the PCA in Displayr:
- Select Insert > Dimension Reduction > Principal Components Analysis.
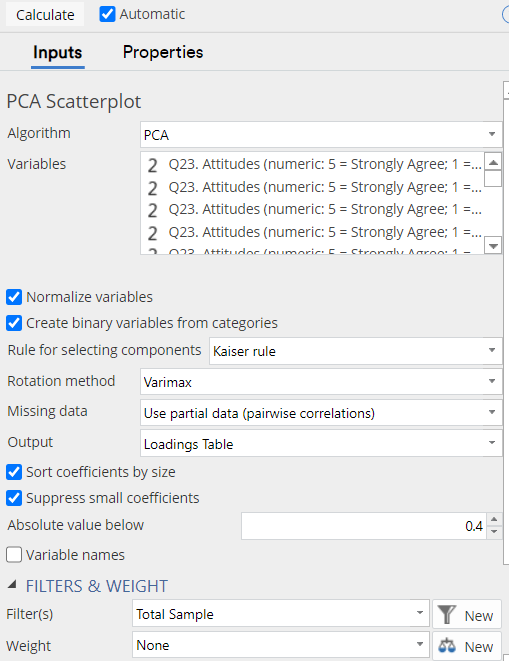
- In the Object Inspector on the right side of the screen, choose the variables that you want to analyze in the Variables box.
- Tick Automatic, which ensures the PCA will remain up to date when the data changes or when you change the settings.
The output from the PCA is what is known as a loadings table. This table shows one row for each of my original mobile phone statement variables (there are 23). Each of the 8 new variables identified by the PCA appears in the columns. The cells of the table show figures referred to as loadings.
These loadings represent the correlations between the new variables and the old variables. As correlations, they will always range between -1 and 1. A score towards 1 indicates a strong positive relationship, a score towards -1 indicates a strong negative relationship, and scores closer to 0 indicate weaker or non-existent relationships. The output omits smaller correlations. However, the bar remains to indicate their values. Change this by toggling the Suppress small coefficients box.
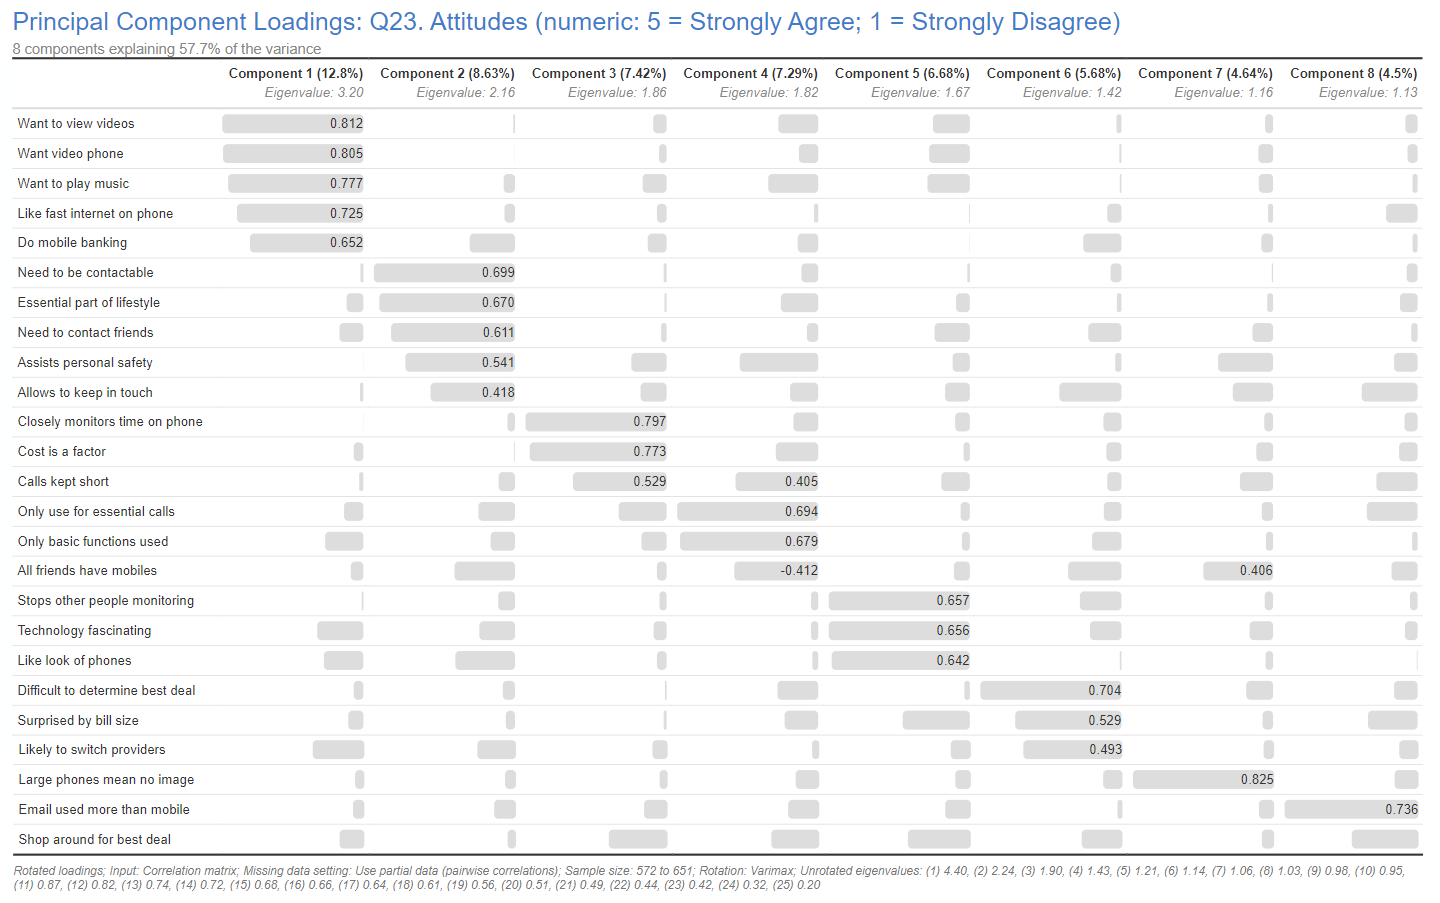
The table is sorted in a way that makes it easy to work out what the 8 new variables mean. The first variable (“Component 1”) shows a strong correlation with the variables for “Want to view videos”, “Want video phone”, “Want to play music”, “Like fast internet on phone”, and “Do mobile banking”. We conducted this study before the age of the smartphone. At the time, these higher-technology features were uncommon in phones.
This new variable thus represents an underlying factor of desire for better technological capabilities in phones. The second variable strongly correlates with variables that reveal a desire to stay in touch and connected. The third variable represents an attitude that phones need only make calls or have basic functionality, and so on.
The output also tells us a number of key bits about the analysis:
- The 8 components represent 57.7% of the original variance in the data. You inevitably lose some information when you reduce variables like this.
- The first variable (“Component 1”) accounts for 12.8% of the variation. The second accounts for 8.63% of the variation, etc. The sort order goes from most variation to the least variation.
- The footer contains additional sample size information and settings info.
In the next few sections, I’ll explain some settings that we didn’t change, and how to save the new variables to your data set so you can use them elsewhere.
Determining the number of components
In the analysis above, the PCA automatically generated 8 variables. It did this using a heuristic known as the Kaiser rule, an option in the Rule for selecting components drop-down menu. This is a commonly used rule, but you can also choose to use two other methods:
- Number of components. Choose this option if you want to choose the number of components to keep.
- Eigenvalues over. Eigenvalues are numbers associated with each component, and these are listed at the top of each column. This setting lets you specify the cut-off value for components.
Rotations
In the analysis above, I used a technique called Varimax rotation, Displayr’s default option in the Rotation method drop-down menu. The concept of the rotation can be a bit abstract to talk about without getting into the mathematics of the technique. Putting it simply, the PCA problem can have an infinite number of solutions which all capture the same amount of variation in the data. The rotation tries to find which of those many solutions is the easiest to write down an interpretation for, by writing them in a way so that as many loadings are as close to zero (or to a value of 1) as possible.
If you have a favorite rotation method to use, the Rotation method drop-down menu contains several other options. They are all described in mathematical terms, so discussing them here would not add much value if you don’t already have a preferred technique. In my experience, Varimax seems to be the most popular.
Saving variables
To use the results of the PCA in another analysis you need to save the variables to your data set. To do so:
- Have your PCA output selected on the page.
- From the menu select Insert > Dimension Reduction > Save Variable(s) > Components/Dimensions. This will add the new variable set to the top of the Data Sets tree.
- (Optional) Right-click on the row labels in the variable set and Rename them, to make the components more recognizable.
Now, you can create a table from the component scores. The table will be full of 0s, indicating that the average score of each is zero. Don’t be alarmed! This occurs because the variables are standardized – with a mean of zero and a standard deviation of 1 – which is the standard technique. If you create a crosstab with another question, then the variation between variables will become more apparent. For instance, I renamed my components and created a table with the Age groups from the study:
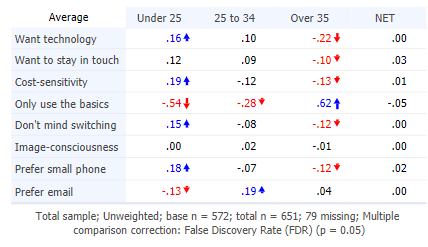
Rather unsurprisingly, the younger people have higher scores on the “Want technology” and “Cost-sensitivity” components, and a much lower score on the “Only use the basics” component.
These new variables can be used just like any other in Displayr. Once you are happy with your new components, go back to the PCA output, and untick the Automatic box. This will prevent any changes to the components. If you modify your PCA later and change the number of components in the solution, you should delete the saved variables and run Insert > Dimension Reduction > Save Variable(s) > Components/Dimensions again.
Hopefully, you find that Principal Components Analysis is easy to do in Displayr, and by saving the variables you can use it to complement your other analyses. Don’t forget the three main steps: set up your data correctly, create the analysis output, and use the output to save your new variables. Good luck and happy dimension reducing!