


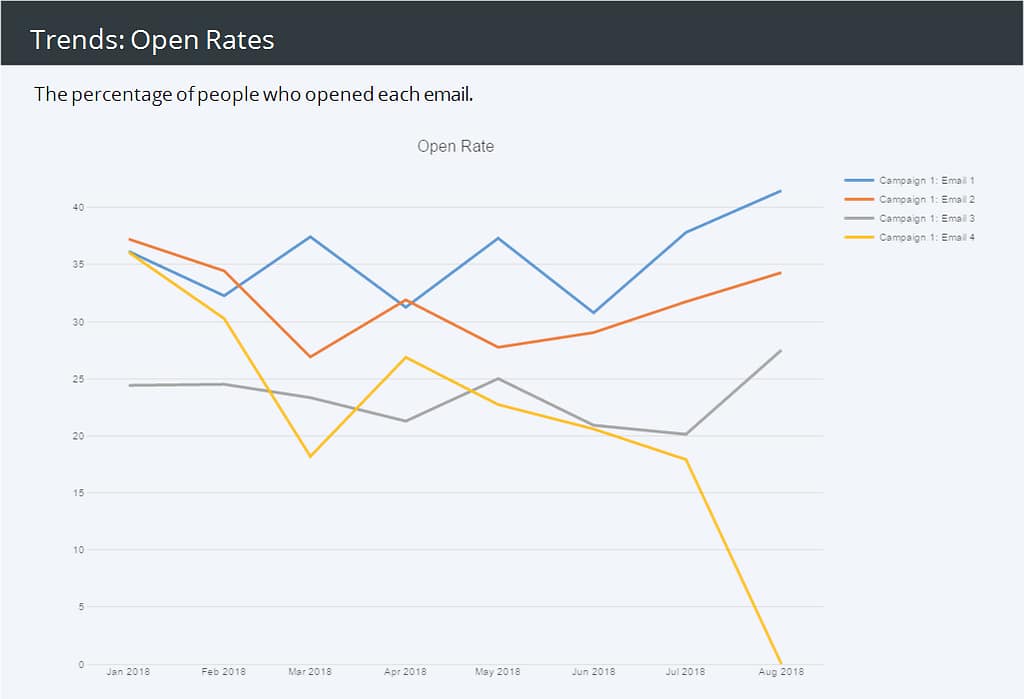
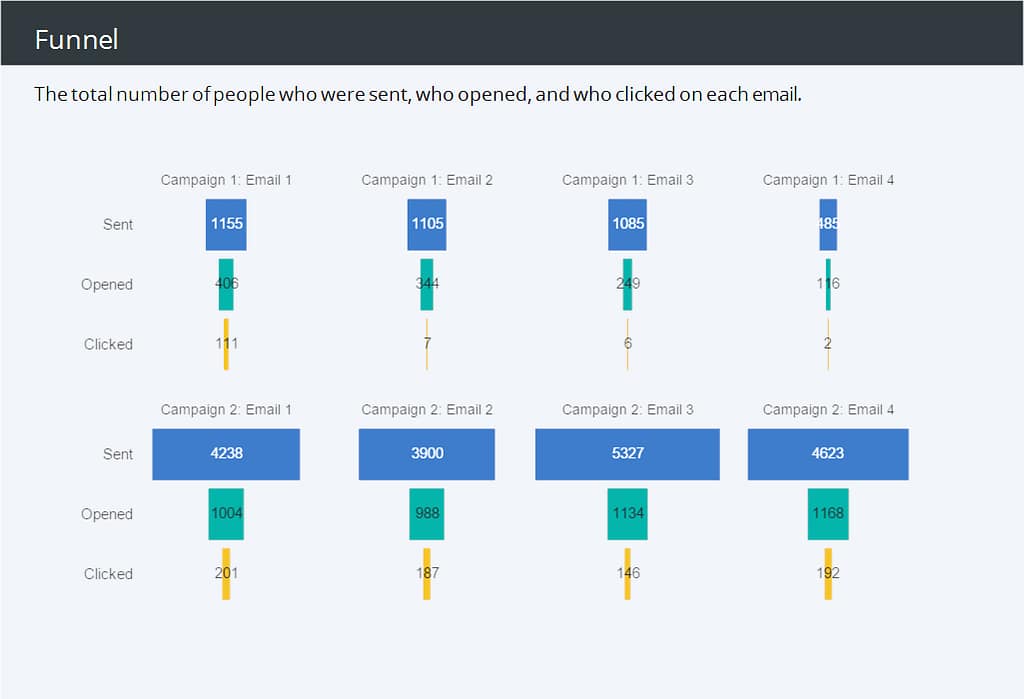
So, you’ve created the perfect user onboarding email sequence. Congratulations! Now what? Now, it’s time to see how well it’s doing! There are many, many metrics you could track, but we focus on a few key measures that will help reveal what’s going on. Namely: number of emails sent, open and click rates, and total campaign engagement. To track these measures, we created our email tracking template. This dashboard visualizes all your email campaigns, allowing you to see at a glance how they’re doing.
If you want to get started right away, click the button above – there are instructions in the template to help you set it up! If you want a little more guidance, keep reading.
Formatting and adding your data
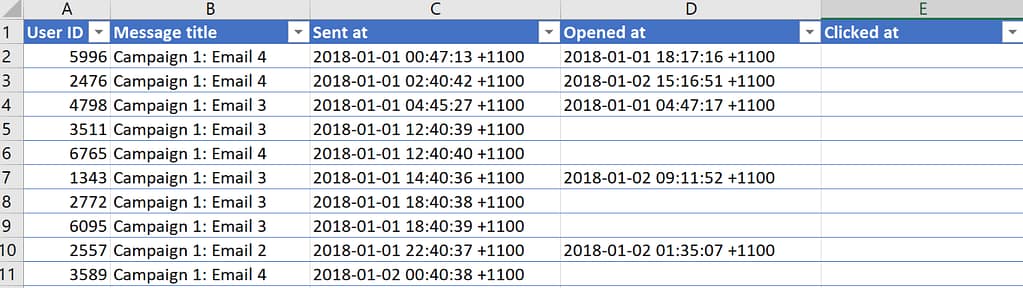
To use your email data with the template, your data needs to be in an Excel spreadsheet. Each row represents an onboarding email sent to a user. The columns of your spreadsheet should contain the following information:
- The email address or user ID of the person the email was sent to
- The title/subject of the email
- The date the email was sent
- The date the email was opening
- The date a link within the email was clicked
Once you have your data in the correct format, add it to the template by clicking the + button next to Data Sets on the left of the screen. (These instructions are in the template as well, so don’t worry if you don’t remember all this!)
The free version of Displayr supports data with up to 1000 rows. If you have more data than this, fear not – you can still use the template! Just follow the prompts to sign up for a free trial.
Connecting your data
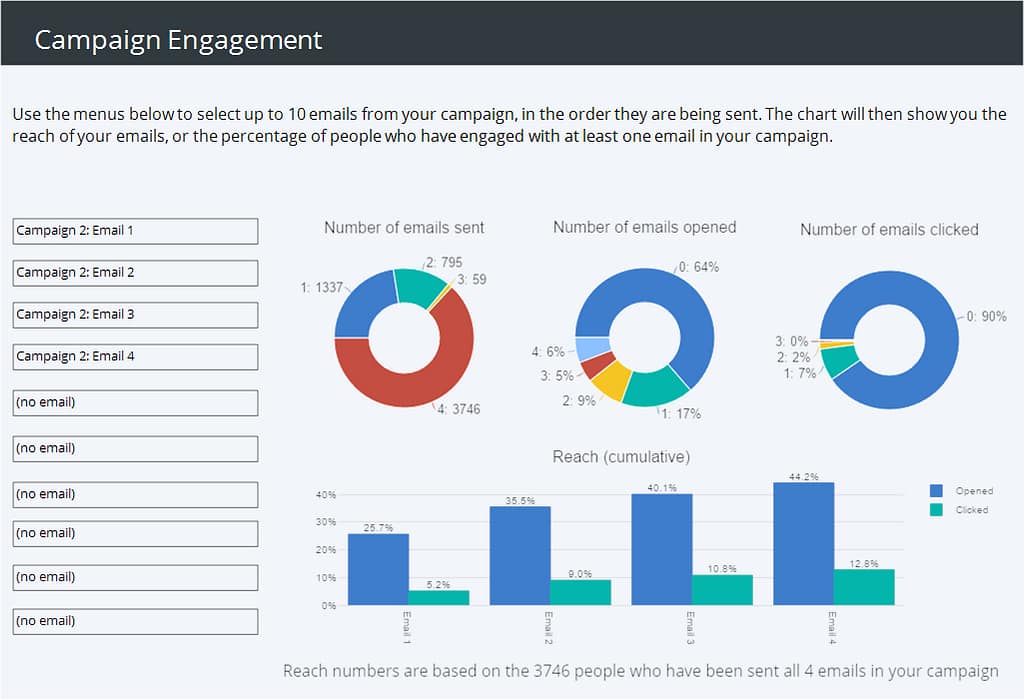
Once you’ve got your data uploaded, it’s time to hook it up to the data! You can do this on the third page of the template by selecting the correct variables on the left side of the page (see below).
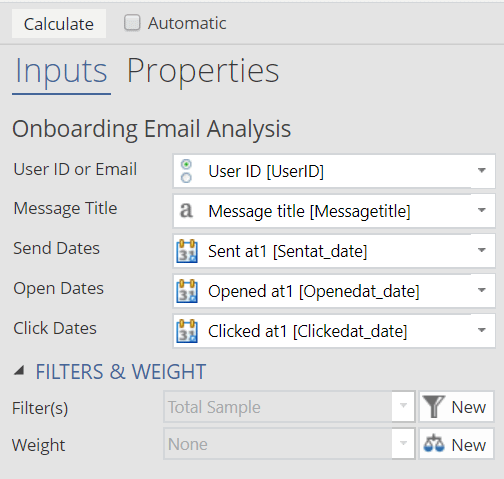
You can choose what dates and emails you want to include, as well as whether you want to see the data by week, by month, or by quarter.
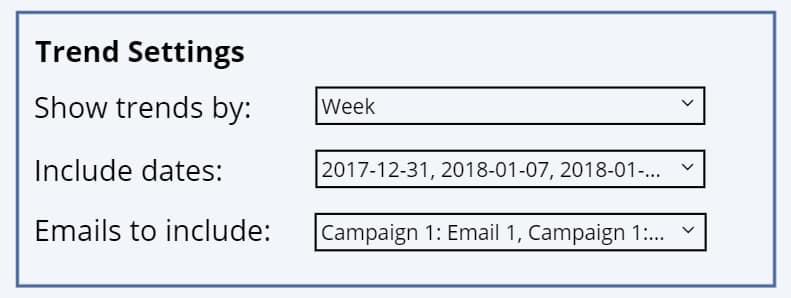
This controls all the visualizations in the dashboard, so you don’t have to update every individual chart if you want to change anything – just change this page and all the other pages will update automatically! This makes it easy to view your data at different time scales, update your data if needed, or view different campaigns.
Publishing your dashboard
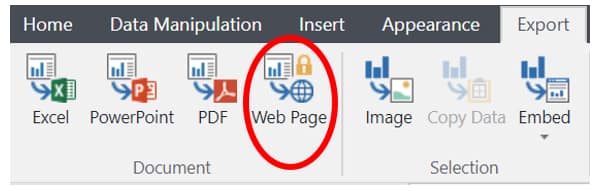
Once your dashboard is all set up, it’s time to export it! To publish your dashboard as a web page, go to Export in the ribbon and click Web Page. This will create your published dashboard. You can share this link with anyone you like, and they can navigate through the dashboard. If you need to go back and change anything, you can just click Embed > Update All and your published dashboard will update.
Handy hint: exporting data from Intercom
Here at Displayr, we use Intercom to manage our email campaigns. Here’s how we export our email data in the correct format for this template:
- Log in to Intercom.
- Select Messages > Report.
- Scroll down and select Export message data.
- Choose the time frame when you’d like to see your data.
- Click Apply.
- Click Export.
- Wait for the email from Intercom to show up, then click Download.
Once you have your data as a spreadsheet, you can cut and paste it into the format specified above. Then just follow the steps to add it to the template!