What Is Market Research Analysis Software?
There are many different stages in the process of market research. Some six steps, others say nine. But regardless of how you split it up, the two main things researchers focus on are the collection of samples and the analysis of this data. Market research analysis software, therefore, is any tool that assists with the process of turning data that has been collected as part of a project into insights.
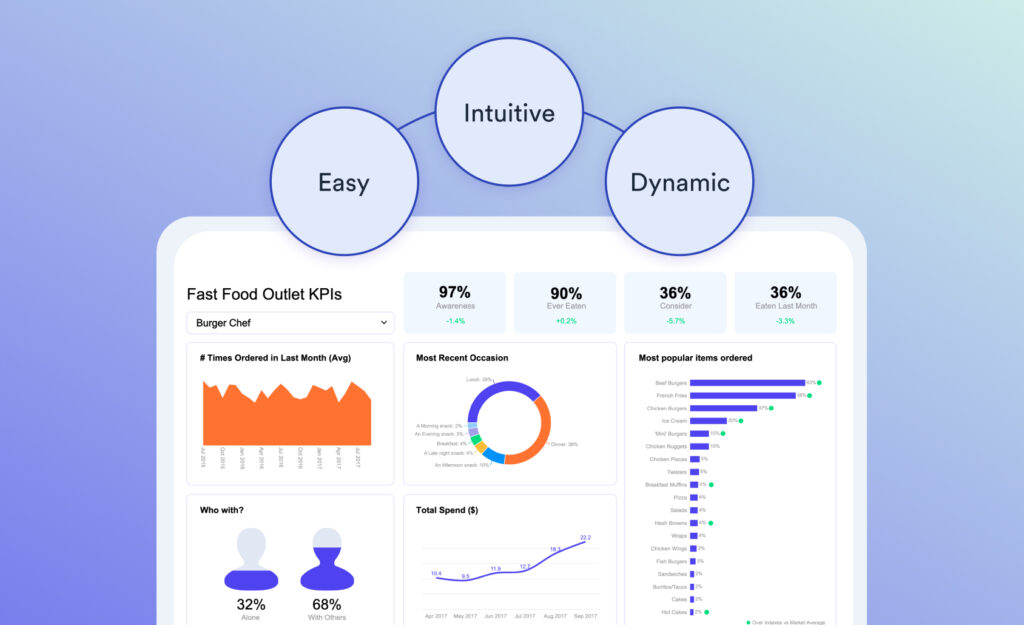
These typically leverage advanced analytics, intuitive visualizations, and automated reporting. Whether you’re a market researcher, consumer insights professional, or business leader, choosing the right software can dramatically improve the speed, accuracy, and impact of your research.
With so many options available, finding the best market research analysis software can be overwhelming. That’s why we’ve compiled this comprehensive list of the top tools in 2025. From all-in-one platforms like Displayr to specialized solutions like SPSS and Tableau, this guide will help you identify the perfect software to elevate your market research and deliver insights that drive success.
Market Observations Software vs. Market Research Software
While market research software focuses on structured data collection and analysis (typically from surveys), market observation software captures unstructured or behavioral data from real-world sources. The difference lies in what is being measured and how it’s collected.
Market research software, as a broader terms, helps researchers design surveys, collect responses, analyze structured data, and generate insights through statistical techniques and dashboards.
In contrast, market observation software is passive and reactive; it observes behavior as it occurs. These tools monitor various aspects, including social media activity, in-store movement, purchase behavior, online reviews, and even facial expressions and foot traffic patterns. They’re ideal for spotting trends, understanding context, and validating what people actually do (not just what they say).
Displayr actually falls under both categories. Although you can not design surveys with Displayr, the tool is purpose-made to analyze survey data. Additionally, these same analysis capabilities work well for the ‘market observation’ data that helps contextualize survey results.
How to Choose the Right Research Analysis Tools
Selecting the best market research analysis software starts with a clear understanding of your specific needs and workflow. Here are some of the main considerations that should guide your decision:
- Level of analysis required: Determine whether you need basic reporting or advanced analytics such as statistical testing, weighting, or correspondence analysis. Some tools excel at simple crosstabs, while others offer sophisticated methodologies for deeper insights.
- Need for interactive dashboards: If sharing insights visually and interactively is important, look for software that enables you to build and customize dashboards that update automatically as new data comes in.
- Collaboration and cloud capabilities: For teams working remotely or needing to collaborate in real time, a cloud-based tool with multi-user access and sharing features will enhance productivity and streamline workflows.
- Technical skills and usability: Assess your comfort with technical tasks. If you or your team are not familiar with coding, prioritize tools with intuitive, drag-and-drop interfaces. Conversely, if you have advanced technical skills, you might benefit from platforms that offer scripting or programming flexibility.
By weighing these factors, you can select a market research analysis tool that fits your organization’s unique requirements and maximizes the value of your insights
Top Market Research Analysis Software in 2025
Displayr
- Simplified workflow: There’s no need to write code or learn complicated processes. Drag-and-drop makes it easy for beginners to analyze surveys in half the time it takes experts in other statistics and BI tools.
- Automated statistical testing: Easily calculate anything from differences between columns through to deep learning, driver analysis, conjoint, and MaxDiff.
- AI-powered text analysis: Advanced AI and NLP for text analysis and verbatim coding
- Automated reporting: Change your input data, and all tables, charts, calculations, and entire reports will automatically update.
- Seamless duplication of work: There’s no need to create new work from scratch; just duplicate and change any existing analysis, visualization, or dashboard.
- Collaborate in the cloud: 10x your team’s productivity with many users working on the same project at the same time.
- Easy to get data in and out: Integrate data with the click of a button. Import data from SPSS, Qualtrics, SQL, URL, Excel, and more. Export as webpages, PowerPoint, Excel, PDF, and embeds.
 Q Research Software
 Q Research Software
Brought to you by the team at Displayr, Q Research Software is a desktop application focused primarily on survey data analysis, especially crosstabs and advanced statistical testing. It shares Displayr’s computational engine, meaning you can expect much of the same when it comes to analyzing your survey data. Q is best for users who need fast, powerful crosstab analysis in a Windows environment and prefer exporting results to PowerPoint for reporting.
Tableau
Tableau is a leading data visualization and business intelligence tool, popular for its ability to turn complex data into interactive, shareable dashboards. It supports a wide range of data sources and offers powerful visual analytics. However, Tableau is not purpose-built for survey data or market research workflows – meaning users often need to preprocess data in other tools before analysis. Tableau is great when it comes to visual storytelling but lacks the specialized statistical and survey analysis features found in Displayr and Q.
Qualtrics
Qualtrics is a market research platform for survey creation, distribution, and analysis, widely used in enterprise settings. Its core strengths are in survey design, data collection, and real-time feedback management. While it offers analytics and reporting, its analysis features are not as advanced or flexible as Displayr’s, particularly for complex research.
MarketSight
MarketSight is a web-based survey analysis tool designed for creating crosstabs, charts, and dashboards. It is easy to use for basic analysis and reporting, offering automated statistical testing and data visualization. MarketSight is suitable for users who need straightforward survey analysis without advanced customization. While it covers the essentials, MarketSight lacks the depth, automation, and collaborative features of Displayr, making it less suitable for complex or large-scale research projects.
WinCross
WinCross is a market research analysis tool that requires more programming knowledge, so it is used by market research consultants (with a specialist DP setting up the tables). WinCross is a tool for creating crosstabs. It needs the user to have ‘programming’ knowledge, so it is not very easy for anyone to use.
SPSS
IBM SPSS Statistics is a long-standing tool in the world of statistical analysis, offering a comprehensive suite of advanced analytics for researchers and statisticians. SPSS can handle large, complex datasets and supports a wide range of statistical techniques. However, it has a steep learning curve, requires knowledge of syntax for automation, and is less efficient for routine survey analysis and reporting compared to Displayr. SPSS is ideal for advanced users needing deep statistical modeling, but is less suited for fast, visual market research reporting
R
R is an open-source programming language and environment for statistical computing and graphics. It is extremely powerful and flexible, supporting virtually any type of analysis or visualization. However, R requires programming expertise and is not user-friendly for most market researchers. Most analysis and reporting tasks must be coded manually, making it less efficient for typical survey workflows. R is best for statisticians and data scientists with advanced needs, but is not practical for everyday market research analysis without a user-friendly interface (like the one you find in Displayr).
How AI Is Changing Market Research Analysis Tools
The rise of generative AI is changing the entire market research landscape, but this is particularly the case when it comes to market research analysis tools. AI-powered platforms now automate complex tasks that once required hours of manual work, enabling researchers to process vast datasets, uncover patterns, and generate actionable insights in real time. Some of the most powerful use cases include:
- Advanced text and sentiment analysis: AI’s natural language processing capabilities enable market research tools to extract meaning from open-ended survey responses, social media posts, and customer feedback at scale. This allows for a deeper understanding of consumer sentiment and the ability to track brand perception across multiple channels in real time.
- Real-time data processing and predictive analytics: Modern AI-driven tools excel at processing live data streams, allowing businesses to react instantly to market shifts, customer behavior changes, or competitor moves. Predictive analytics powered by machine learning helps forecast trends, identify emerging opportunities, and anticipate consumer needs—capabilities that were previously out of reach for most organizations.
- Streamlining tasks: AI tools can automatically analyze both quantitative and qualitative data, produce interactive dashboards with minimal user intervention, and even help with interpreting results. This automation dramatically reduces the time from data collection to insight, freeing up researchers to focus on strategy and interpretation rather than repetitive processes.
Want to find more use cases for AI in market research? Download Displayr’s 5 Ways to Use AI in Market Research Today whitepaper.