


Text data is one of the great pains of survey analysis. Open-ended questions allow us to obtain data that is less biased by our preconceptions. But, it takes so long to read and interpret it! In this post, I describe two strategies for analyzing such data in Displayr. A quick-and-dirty approach and a quite-fast-and-awesome approach.
The data
The data is from a study of the (mobile) cell phone market. We asked people what they liked about their main cell phone provider. The raw responses are in the table below.
Fully automated text analysis (quick and dirty)
The quick-and-dirty approach to analyzing text data in Displayr is to:
- Go to Insert > Text Analysis (Analysis) > Automatic Categorization > Unstructured Text.
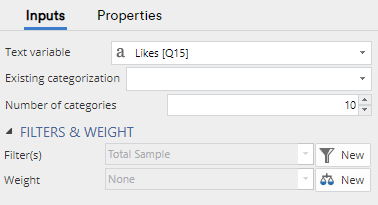
- In the Object Inspector (the section that opens on the right of the screen), under Inputs > Text variable select the variable that holds the text you want to analyze.
- Change the Inputs > Number of categories to the number of categories you would like to classify the data into. I’ve chosen 10 for this example.
The output will calculate automatically (may take a little while to think).
The category names on the left are something of pot luck. In this output you can see:
- the automatically generated categories,
- the center column the proportions
- counts of the number of cases
- examples of the types of responses that have been allocated.
Ready to analyze your text?
Start a free trial of Displayr.
We haven’t yet cracked an algorithm that reliably gives human-understandable names. So, the secret is very much to look at the example and to expand out the examples (clicking the grey triangle ▶) to see all the data.
From our experience and reports from our clients, fully-automatic text analysis can often give good insight. But it is not as good as doing manual coding. This is where the next approach comes in handy.
Automatic updating of text analyses (wide and awesome)
The gold-plated approach to efficiently doing automated text analyses is as follows:
- Manually or semi-automatically perform an analysis of, say, 300 text responses.
- Insert > Text Analysis > Automatic Categorization > Unstructured Text
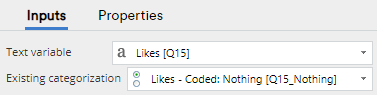
- In the Object Inspector, set Existing categorization to the variable set that contains the manual or semi-automatic categorization.
Displayr will then train a machine learning model using the existing categorization and predict the categories for the remaining text, often with extremely high accuracy.
Fully automated categorization (the first part of this article) only forms mutually exclusive categorizations. However, when you use it for automatic updating, as per this section, it also works for overlapping (multiple response) categorizations.
How to Save the Categories to your Data Set
You can easily save the categories assigned to your data – so that you can use them in other analysis. Make sure that the output above is selected on the Page and then go to Insert > Text Analysis > Advanced > Save Variable(s) > Categories. A new variable appears in your Data Sets called “Categories from…”
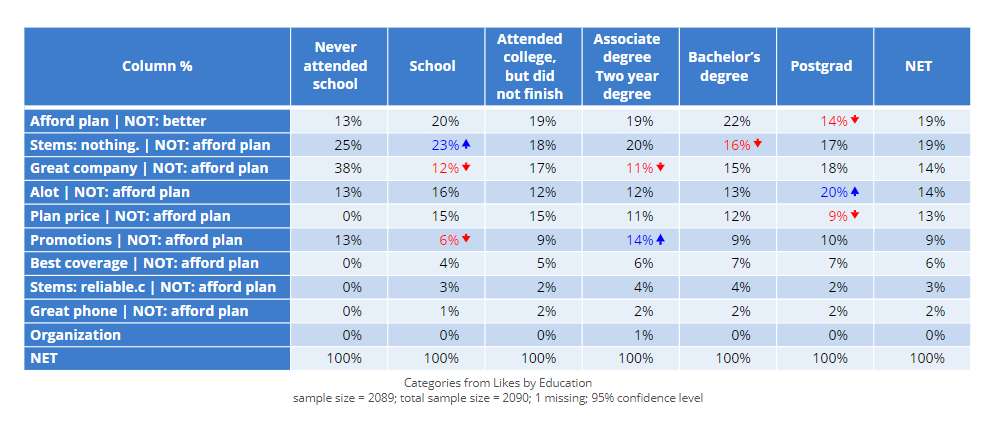
To create a simple example of a table that uses categorized data and another variable, drag the “Categories from” variable from the Data Sets pane onto a document Page. In the results are below, I also crossed the automatically generated categories with the education level of the respondents (by placing it in the columns of the table).
Other automated approaches
The approach described above uses what we call unstructured text. Sometimes text data can have much more structure. We have two other tools designed for automatically categorizing such data:
- Insert > Text Analysis > Automatic Categorization > List of Items is designed for brand lists and other lists.
- Insert > Text Analysis > Automatic Categorization > Entity Extraction identifies people, places, and other entities automatically from data.
Want to try it yourself? Start a free trial.
