

A practical question when designing a customer feedback survey or experiment is to work out the required sample size. That is, what is the smallest number of data points required in the survey or experiment? There are three basic approaches: rules of thumb based on industry standards, working backwards from budget, and working backwards from confidence intervals. When it comes to analyzing survey data, each of these approaches can be useful.
Working out sample size based on rules of thumb
Different industries have different rules of thumb when it comes to testing. These rules of thumb are not entirely made up; their logic relates to the confidence intervals analyses described later in this article.
Some examples of common rules of thumb are:
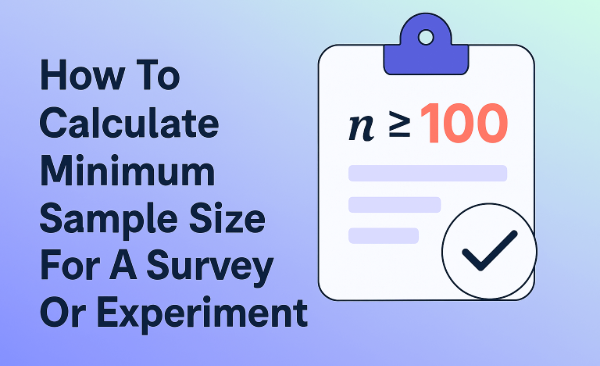
- Studies should involve sample sizes of at least 100 in each key group of interest. For example, if you are doing an AB test, then you would typically want a minimum sample size of 200, with 100 in each group. An exception to this is when testing anything where the actual rate being tested is small. For example, if testing conversion rates, where the typical conversion rate may be 2%, a substantially larger sample sizes are required.
- Sensory research studies, where people are given food products and asked to taste them, typically have a sample size of at least 60 per key group.
- In commercial market research, samples of less than 300 are usually considered to be too small. For strategically important studies, sample size of 1,000 are typically required. A minimum sample size of 200 per segment is considered safe for market segmentation studies (e.g., if you are doing a segmentation study and you are OK with having up to 6 segments, then a sample size of 1,200 is desirable).
- For nation-wide political polls, sample sizes of 1,000 or more are typically required. The logic of sampling means that whether a poll is nationwide or not should not be a consideration, but, in practice, it is usually taken into account.
- Early feasibility studies for medical devices have sample sizes of 10, traditional feasibility studies have sample sizes of 20 to 30.[1]
- If performing inspections, such as of outputs from a manufacturing plant or crops, it is common to apply a rule that sample size should be Sqrt(N) + 1, where N is the population size.

Working out survey sample size from costs
A second common approach is to identify the budget and work backwards, using the following formula:
Sample size = (Total budget – fixed costs)/cost per data point
This may sound crude, but the budget for a study is a way of working out the appetite for risk of the organization that has commissioned the study, and, as discussed in the next section, this is at the heart of determining sample size.
Working out sample size from confidence intervals
One of the reasons that the minimum sample size guidelines vary so much is that the true minimum sample size required for any study depends on the signal-to-noise ratio of the data. If the data intrinsically has a high level of noise in it, such as political polls and market research, then a large sample is required. In tightly controlled environments, such as those used in sensory studies, there is less noise, and thus, smaller sample sizes are acceptable. When testing medical devices, the outcome is to see if the device is problem-free or not, rather than to estimate any specific rate, so an even smaller sample size is appropriate.
One formal method for working out sample sizes is to have researchers specify the required level of uncertainty they can deal with, expressed a confidence interval, and work out the sample size required to obtain this. For example, see here and here for examples and discussions, respectively.
This is the textbook solution to working out sample size, and there are lots of nice theoretical concepts to help (e.g., power analysis). However, in practice, the approach only works when you have a good idea what the likely result will be and what the likely uncertainty will be (i.e., sampling error), and this is often not the case, outside of the world of clinical trials.
Learn how to statistically test Net Promoter Score in Displayr
[1] https://www.fda.gov/downloads/MedicalDevices/NewsEvents/WorkshopsConferences/UCM424735.pdf