


Displayr can create bespoke calculations, making it easy to go beyond the observed data to help tell your story. This saves you from using multiple applications, for example, having some of your workings in Excel.
Indeed, you can replicate much of what you might want to do in Excel using the Calculation Grid … it can be used to create interim calculations and, importantly, combine different types of data in one table.
Beginning with the end in mind …
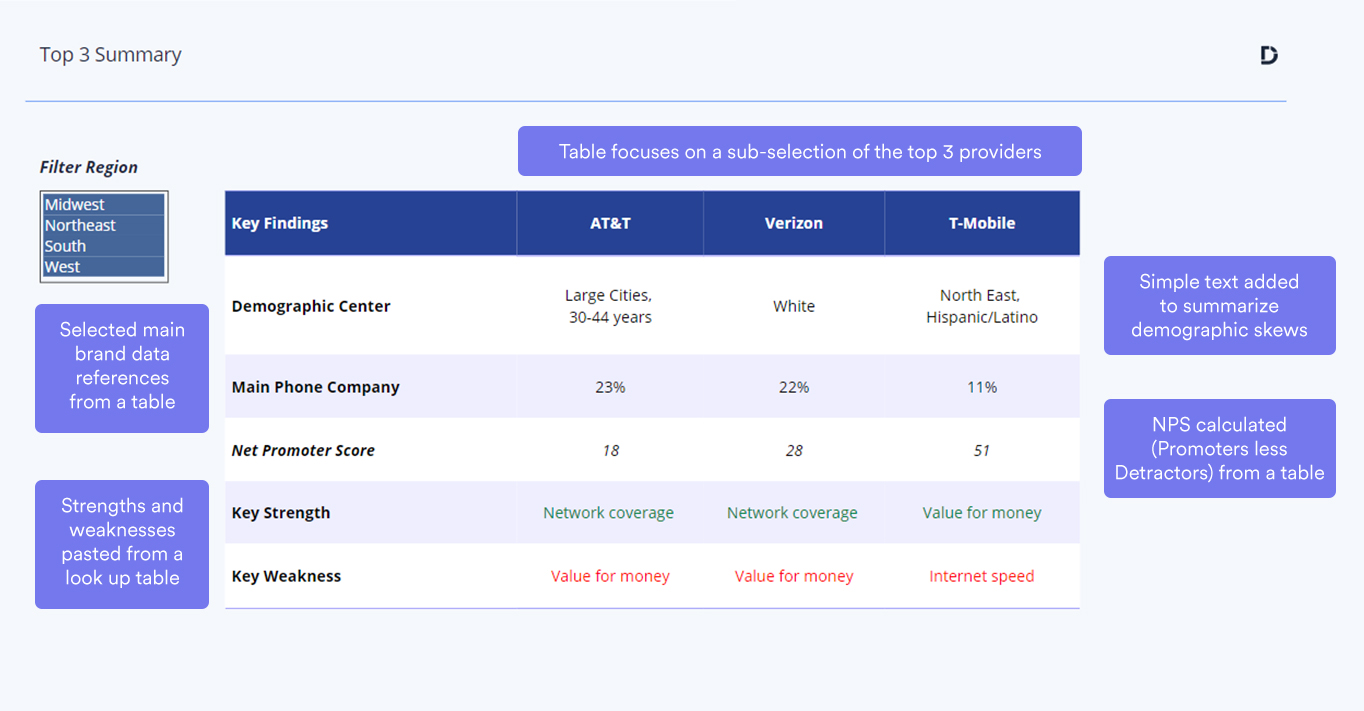
The end game here is to create a table like this, which summarizes data from several questions in a single, easy-to-format, matrix-style table.
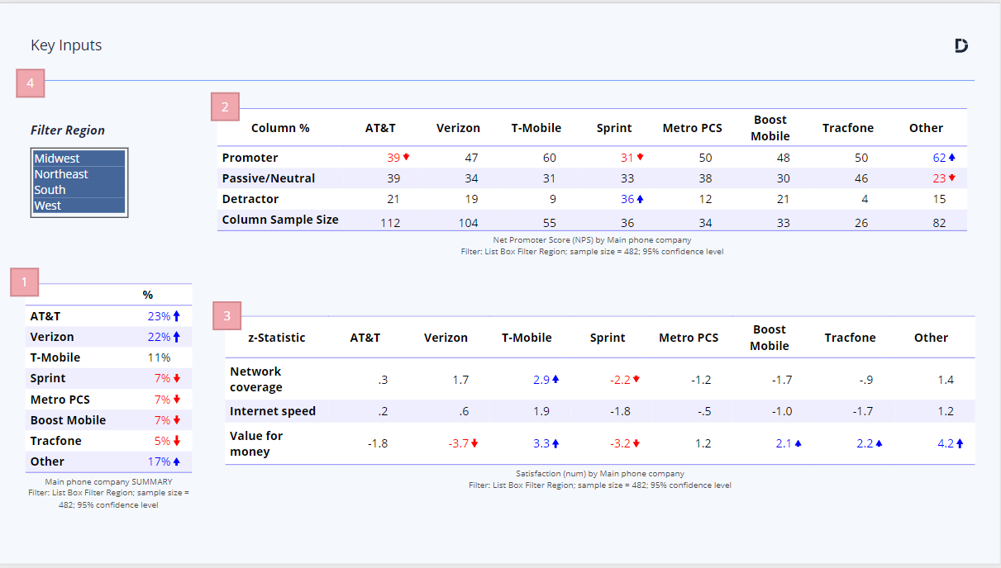
Key Inputs
This table is built using these four inputs …
- Ranked (disguised) data on the Main Cell Phone provider. Given the structure of the market, we only want to focus on the Top 3
- Net Promoter Score results (click for more information on Net Promoter Scores or NPS)
- Satisfaction with three critical elements of the service offer. The table shows Z-Statistics to tease out relative strengths and weaknesses.
- A filter control (click for more information).
All inputs 1-3 are linked to the filter control.
Earlier, I’d also prepared cross-tabs for Main Phone Company by all demographics and sorted them in order of significance to help zero in on the main differences.

Creating our composite or summary table.
Take a look at the process in action in this short video.
The key steps are:
- Insert a Calculation Grid of the required dimensions
- Double-click into cells to edit labels and enter simple text as we go (text information needs to be contained within “quotation marks”)
- Copy selected cells from the “Main Phone Company” table and paste them into the Grid. Formulae with references are created automatically, e.g., table.Main.phone.company.4[1]
- Enter a formula for the first Net Promoter Score calculation (Promoters minus Detractors) by clicking into the required cells and adding mathematical operations as we go: table.Net.Promoter.Score.2[1, 1]-table.Net.Promoter.Score.2[3, 1]
- Using a bit of Displayr magic, enter code to sort the satisfaction scores in memory and read off the label of the highest ranked row for the first column: names(sort(table.satisfaction.2[, 1],decreasing=TRUE))[1]. This gives us “Key Strength”.
- Repeating step 5 for “Key Weakness,” replacing decreasing with increasing in the formula.
- Selecting the formulae created for steps 4, 5, and 6 and dragging to autofill these same formulae for the other columns.
The only limit is your imagination.
As you can see, Displayr’s Calculation Grids allow you to customize your analysis, making it easy to go beyond the observed data without having to do your workings elsewhere. You can easily change and manipulate calculations once they are set up; everything is connected. This saves you time, which you can then apply to other ways to add value to your data.
If you want to know more about Calculation Grids or Displayr generally, book a demo or take a free trial.
