

The need to view and potentially edit raw data is common amongst survey researchers.
Some use cases for instance:
- Identifying and removing rogue respondents (speeders, flat-liners*, inconsistent responses, etc.).
- Fixing up an error that was missed in the survey scripting process
- Pasting in matching variables from another source (typically Excel), to allow them to be included in the analysis.
- Publishing filtered versions of the data file.
- Publishing clean versions of the data file (i.e. without ‘created’ variables, hidden programming variables) for external client use.
Displayr’s raw data editing and publishing features have a lot of built in functionality. As a result the deliver to these needs, with ease.
* Tip: Displayr can automatically identify flat-lining or straight-lining (respondents giving the same answer for all questions in a set). It gives you a report on questions effected. From the main menu select Anything > Reports
Accessing the Raw Data Editor
To open the Data Editor, select one or more variables (or combined variable sets) in the Data Tree, then right-click and select “View in Data Editor”. Alternatively, there is a button in the Object Inspector with the same name if you have a variable/variable set selected. You can also use the button that appears on the preview tooltip when hovering over a variable or question. The Editor will appear at the bottom of the screen showing the raw variables that you have selected.
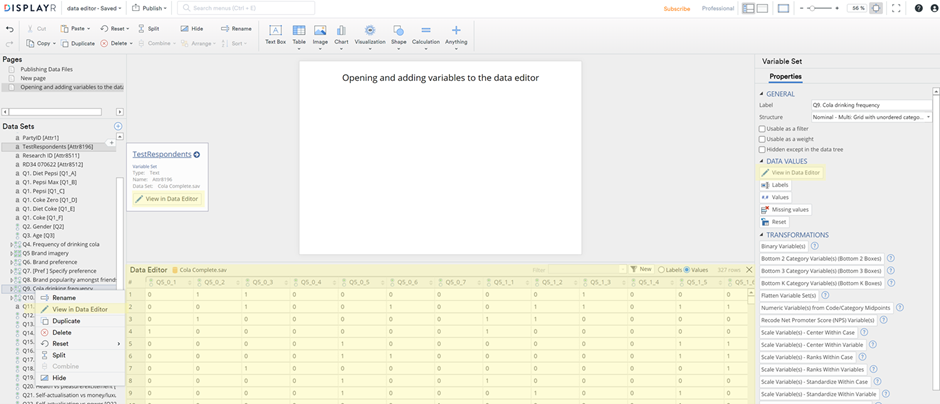
You can also drag more variables to it once open and drag-and-drop columns inside the Data Editor. As a result you can reorder them as you like.
Using the Raw Data Editor
Manipulating the table
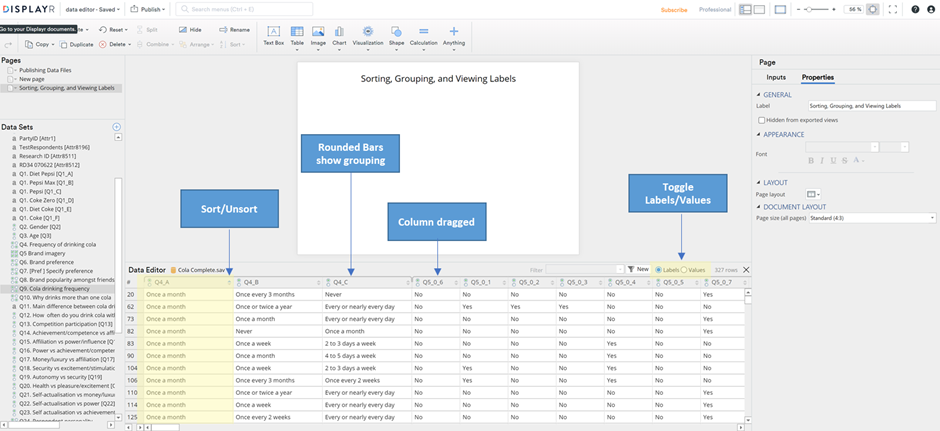
The column headers contain the ‘names’ (not labels) of the variables. The row headers contain the Raw Case Numbers. The rounded bars above each column show which Variables are grouped into Variable Sets. To toggle between showing raw values or labels, use the control at the right of the header.
You can sort your data using the sorting icons in the column headers. The first time you click, that column will be sorted in Ascending order. The second time you click it will toggle to Descending and a third click will reset it to not be sorted. You can sort by multiple columns in the order you activate their sorting.
Editing
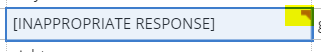
Values can be edited directly by double-clicking on a cell or pressing “Enter” *. Edited cells have a “flag” added so you know which have been modified.
In the Data Editor you can right-click on edited values and select “Revert” to restore the data to it’s original state. You can also do this in the Data Sets tree for entire variables.
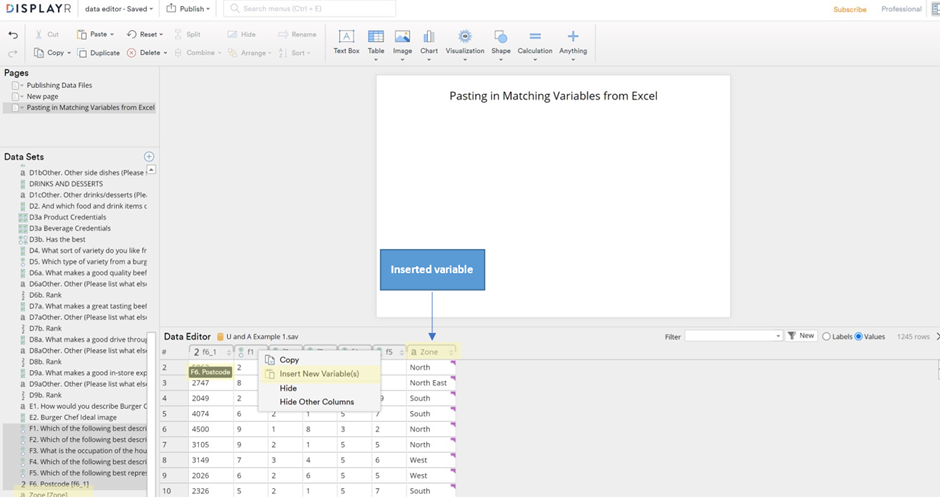
You can also copy and paste values or ranges of values within the Data Editor or copy to or paste from Excel. If you have one or more full columns of values in Excel, you can copy them, right-click on a column header in the Data Editor and select “Insert New Variable(s)”. These are added to your Data Source in Displayr. You can then use the new variable(s) as you would any other in Displayr.
In this example, we temporarily copied “Postcode” from the Data Editor, pasted into Excel, used a LOOKUP function to assign a Geographic Zone code, and “Inserted” this in Displayr. as a result it becomes available in the Data Sets tree.
* Calculated variables (e.g. JavaScript or R variables) cannot be edited.
Deleting
Firstly, you can delete individual rows (cases) by clicking on the row header. Use Ctrl-clicking to add more rows tor Shift-clicking to select a range of rows. Just right-click in a selections and select “Delete Row(s)”.
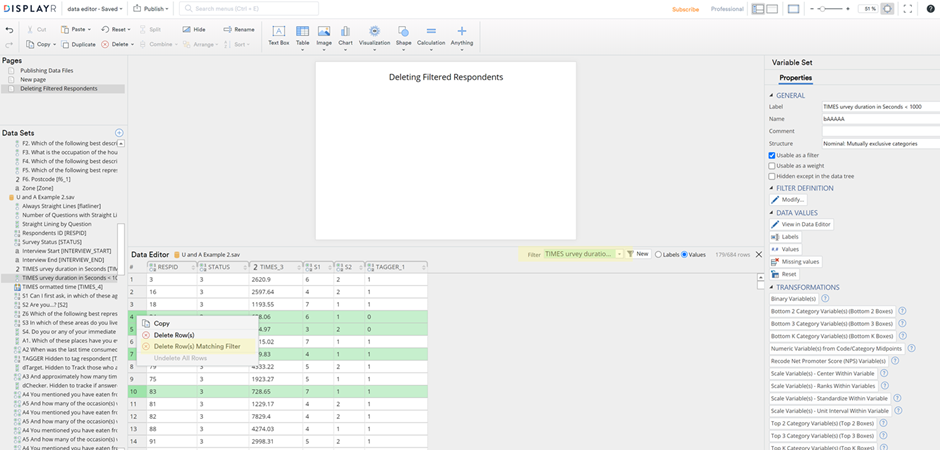
Secondly, you can delete rows that match a filter using the control near the right of the header of the Raw Data Editor. Select an existing filter (or create one in the Data Editor) by selecting “New”) and the matching rows will be highlighted in Green. Right-click one of the matching rows, then select “Delete Row(s) Matching Filter”.
This example is from a large scale “Usage and Attitude” study, where we would expect the interview length to be an absolute minimum of 15 minutes. Survey length here is measured in seconds. We created a filter to select respondents with the equivalent of 15 minutes in seconds and these respondents are highlighted. We can easily now remove them from the data.
To restore deleted rows, select the data source in the Data Tree, then in the Object Inspector click “Undelete observations…”.
Publishing (or exporting) edited data.
You can publish a data file that reflects the edits made – from the “Publish” menu (top of screen) select “Export Data” and then choose your format. Currently there are options for SPSS (*.sav) or Excel (*.csv) formats.
Use cases include for instance:
- If the original file required a lot of cleaning, you may want to export and use an updated version, for the purposes of project efficiency.
You may want to (for example) break a multi-country study into country specific files. - You may want a version of the file for your external client that has your workings and “programmed” variables hidden.
Read more about this here: Publishing Data Files
The complete package.
Displayr already features state-of-the-art advanced analysis tools, excellent table and visualization functions, and editable and updatable PowerPoint exporting. With the Data Editing feature, it is even more so the complete package, for all your survey analysis and reporting needs.