

If you’ve studied a bit of statistics or machine learning, there is a good chance you have come across logistic regression (aka binary logit). It is the old-school standard approach to building a model where the goal is to predict an outcome with two categories (e.g., Buy vs Not Buy). If you are a good statistician with a lot of time on your hands it is a great technique. But for everybody else, it has been superseded by various machine learning techniques, with great names like random forest, gradient boosting, and deep learning, to name a few. In this post I focus on the simplest of the machine learning algorithms – decision trees – and explain why they are generally superior to logistic regression. I will illustrate using CART, the simplest of the decision trees, but the basic argument applies to all of the widely used decision tree algorithms.
Create your own CART decision tree
Logistic regression’s big problem: difficulty of interpretation
The main challenge of logistic regression is that it is difficult to correctly interpret the results. In this post I describe why decision trees are often superior to logistic regression, but I should stress that I am not saying they are necessarily statistically superior. All I am saying is that they are better because they are easier and safer to use. Even the most experienced statistician cannot look at the table of outputs shown below and quickly make precise predictions about what causes churn. By contrast, a decision tree is much easier to interpret.
Decision trees: the easier-to-interpret alternative
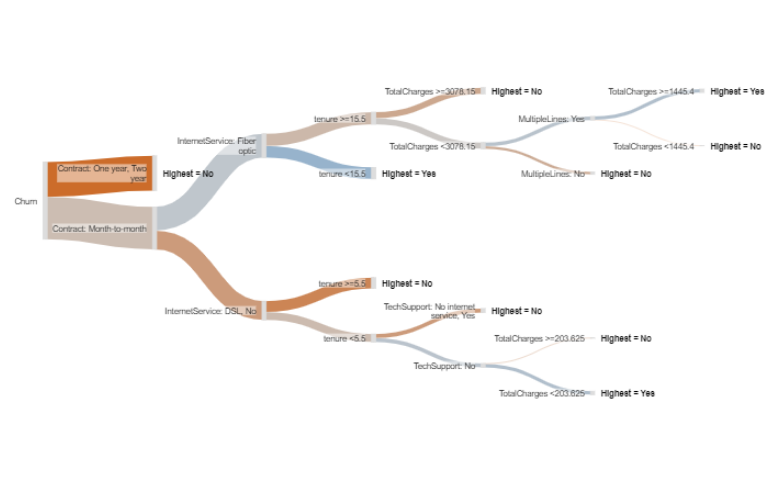
The decision tree below is based on an IBM data set which contains data on whether or not telco customers churned (canceled their subscriptions), and a host of other data about those customers. The decision tree shows how the other data predicts whether or not customers churned. This is an interactive visualization that allows you to hover, zoom, and collapse things by clicking on them (best viewed on a desktop).
The way to read it is as follows:
- The single best predictor of churn is contract length. We know this because it appears on the far left.
- People with a month-to-month contract are different from those with a one or two year contract. The type of decision tree I have used (CART) always splits into two categories. Because one and two years have been combined we know that the difference between these two groups is less than their difference to month-to-month. It does not necessarily mean that there is no difference between one and two year contract people in terms of their propensity to churn. The decision tree could, if the data warranted, split people further on in terms of one and two year contracts.
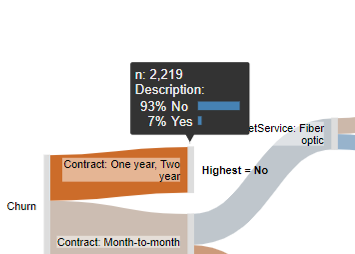
- People with a one or two year contract are less likely to churn than those with a month-to-month contract. We can see this by the color shading, where bluer means more likely to churn and redder means less likely to churn. If you hover your mouse over the nodes, which are the grey vertical rectangles, you can see the underlying data, as shown to the right, which tells us that people on a one or two year contract have only a 7% chance of churning.
- There are more people on a month-to-month contract than are on a one or two year contract. We know this because the corresponding “branch” of the tree is thicker. We can also see the number of people by hovering over the node.
- If we know somebody is on a one or two year contract, that is all we need to know. The predictions of the model do not require splitting this branch further.
- Among the people on a one month contract, the best predictor is their internet service, with people on a fiber optic service being much more likely to churn (again, we can see this both by the blueness of the branch, and if we hover over the node).
- Among people with a month-to-month contract who have a fiber optic connection, if their tenure is 15 months or less, they are likely to churn (69%), whereas those on the fiber optic plan with a longer tenure are less likely to churn.
In this manner we can continue explaining each branch of the tree.
Decision trees are safer
The problem of logistic regression being hard to interpret is much more serious than it first appears. As most people are not able to interpret it correctly, they end up not even noticing when they have stuffed it up, leading to a double boo-boo, whereby they inadvertently create a model that is rubbish, which they then go on to misinterpret. Am I talking about you? Are you using feature engineering to ensure that the linear model isn’t a problem? Did you use an appropriate form of imputation to address missing data? Are you controlling your family-wise error rate or using regularization to address forking paths? How are you detecting outliers? Are you looking at your G-VIFs to investigate multicollinearity? If you are reading this and thinking “what?”, then the options are to go back to graduate school and invest in some stats learning, or say goodbye to logistic regression and replace them with decision trees.
The great thing about decision trees is that they are as simple as they appear. No advanced statistical knowledge is required in order to use them or interpret them correctly. Yes, sure, there are ways you can improve them if you are an expert, but all that is really required to be successful when you use them is common sense.
Decision trees predict well
With the data set used in this example I performed a test of predictive accuracy of a standard logistic regression (without taking the time to optimize it by feature engineering) versus the decision tree. When I performed the test I used a sample of 4,930 observations to create the two models, saving a further 2,113 observations to check the accuracy of the models. The models predicted essentially identically (the logistic regression was 80.65% and the decision tree was 80.63%). My experience is that this is the norm. Yes, some data sets do better with one and some with the other, so you always have the option of comparing the two models. However, given that the decision tree is safe and easy to understand, this means that, to my mind, it is always the safer alternative.
However, if your focus is solely on predictive accuracy, you are better off using a more sophisticated machine learning technique, such as random forests or deep learning.
So why, then, are logistic regressions better known than decision trees?
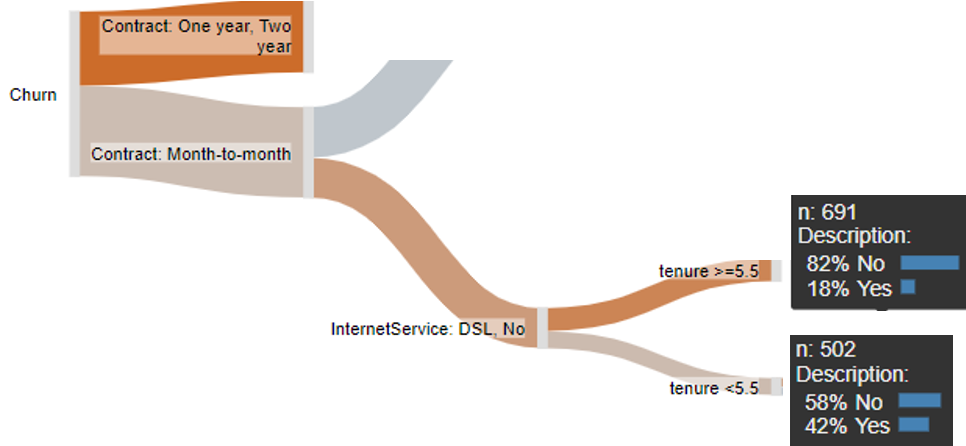
In addition to the benefit of being a lot older, logistic regression is, if you have a lot of time and expertise, pretty cool and does some things a lot better than a decision tree. Consider, for example, the role of tenure shown below. The decision tree tells us that if somebody is on a month-to-month contract, with DSL or no internet service, the next best predictor is tenure, with people with a tenure of 6 months or more having an 18% chance of churning, compared to a 42% chance for people with a tenure of less than 6 months. As far as predictions go, this is a bit blunt. It seems unlikely that 6 months is the magical cutoff. A more likely explanation is that the real situation is that the likelihood of churn drops a little for every additional month of tenure. Decision trees simplify such relationships. A logistic regression can, with appropriate feature engineering, better account for such a relationship.
A second limitation of a decision tree is that it is very expensive in terms of sample size. Each time it splits the data using a predictor, the remaining sample size reduces, and eventually gets to a stage where there is not enough data to identify further predictors. However, it is likely that some of these further predictors are still relevant. By contrast, logistic regression looks at the simultaneous effects of all the predictors, so can perform much better with a small sample size. The flip side of this is that often effects are sequential rather than simultaneous, in which case decision trees are much better. The decision tree shown in this post is a good example of a case where such a sequential relationship likely does make more sense; if somebody is on a contract they are locked in and other predictors are likely not relevant (and would incorrectly be assumed to be relevant if applying typical logistic regression).
Another weakness of decision trees is that they have their own potential for misinterpretation, with many people incorrectly assuming that the order with which predictors appear in a tree tells you something about their importance. Unfortunately, this is often not the case. For example, if you have two highly correlated predictors, only one of them may appear in the tree and which one it is will be a bit of a fluke.
The consequence of all of these strengths of logistic regression is that if you are doing an academic study and wanting to make conclusions about what causes what, logistic regression is often much better than a decision tree. However, if instead the goal is to either make a prediction, or describe the data, then logistic regression is often a poor choice.
Create your own CART decision tree
Technical details
There are lots of different algorithms for creating decision trees. In this post I have used a classification tree, created in Displayr using Insert > Machine Learning > Classification And Regression Trees (CART). There are also a number of different ways of showing decision trees; in this post I am showing the decision tree as a sankey diagram, which is I think the best way (but is not the most common way) of showing decision trees.
When creating a decision tree, you will need to determine how big the tree should be. If the goal of the logistic regression is predictive accuracy, it is usually advisable to create the tree that maximizes predictive accuracy based on cross-validation. In Displayr, this is is achieved by setting Pruning to Minimum error (which is the default).
If the goal when creating a decision tree is to describe the data, focusing more on what has happened in the past than on predicting what will happen in the future, it can be useful to either:
- Create a smaller tree, if the one that maximizes predictive accuracy is too big. One way to do this is set Pruning to Smallest tree, which finds a relatively small tree with relatively good predictive accuracy
- Create a bigger tree, if the one that maximizes predictive accuracy is too small. This can be done by setting Pruning to None. Keep in mind if selecting this option that there is a good chance that some of the relationships that appear in the smaller branches will be flukes.
Have we convinced you? Create your own decision tree here!