

Displayr’s approach to filtering is uniquely powerful. Filters can be applied to tables, charts, complex visualizations, advanced analyses, and text (with a bit of care). You can even filter an entire report, which means that filters are great when implementing automated reporting.
Click here for an interactive tutorial on filtering
Example: Filtering Google NPS Data
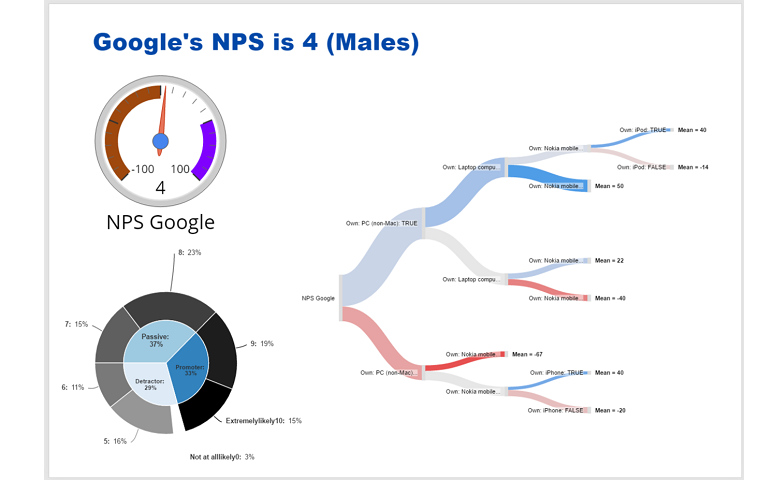
Net Promoter Score (NPS) is a metric for evaluating the popularity of a brand. The screenshot below shows a dashboard of Google’s NPS among men. The cool thing about it is that this dashboard was created for the entire database, men and women combined. Once it was finished, a single mouse click applied the Males filter to the whole page. The charts and title updated and the decision tree was re-estimated. You can view the original dashboard in Displayr and collapse, expand and zoom in and out of the decision tree to see it better.
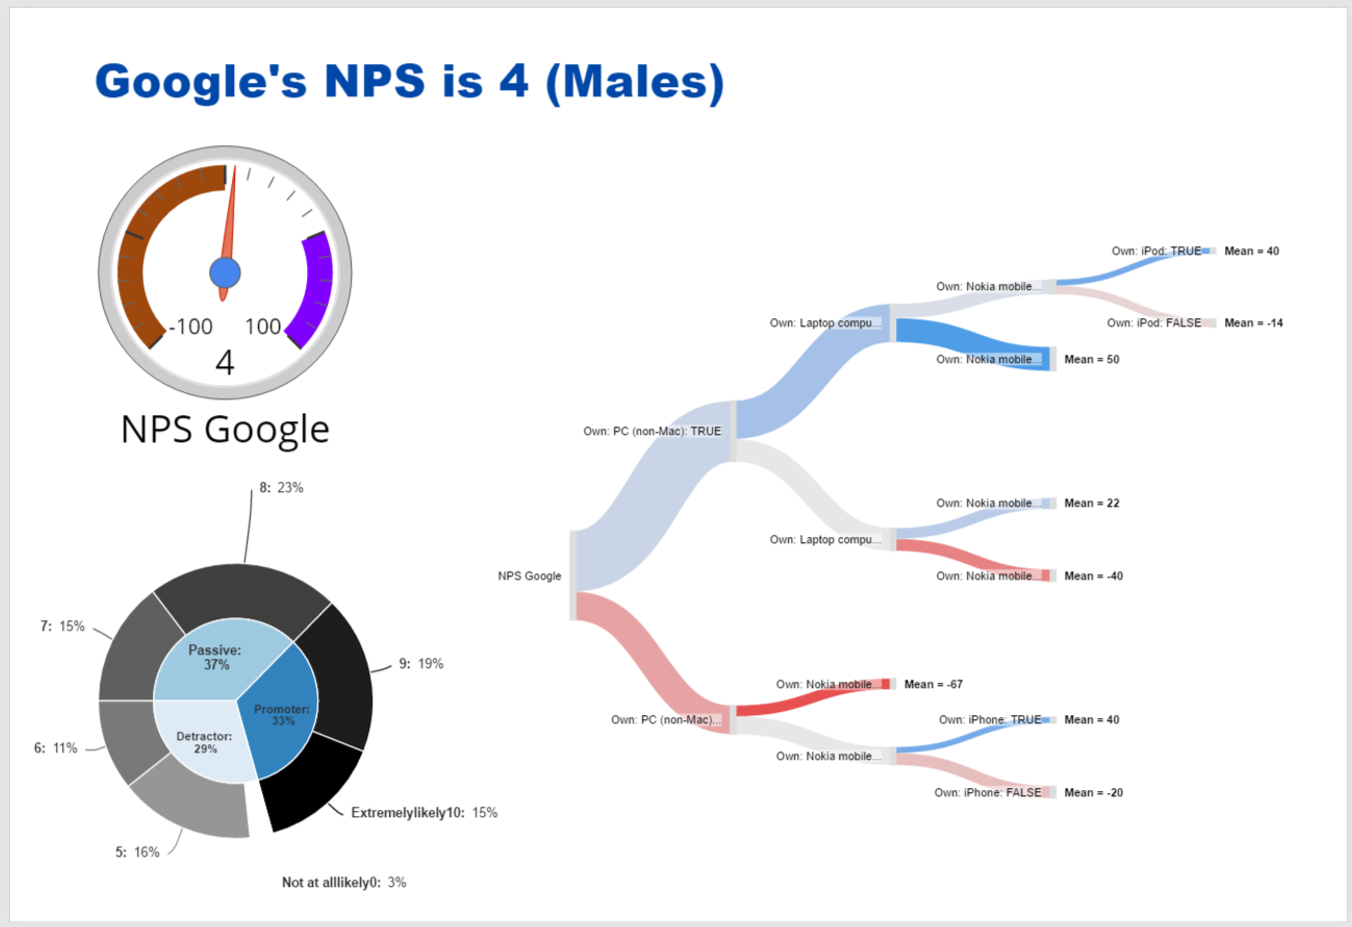
Here is the same dashboard again. This time it has been filtered to show the data for Females. As you can see, all the numbers and the decision tree have changed.

How to apply a filter in Displayr
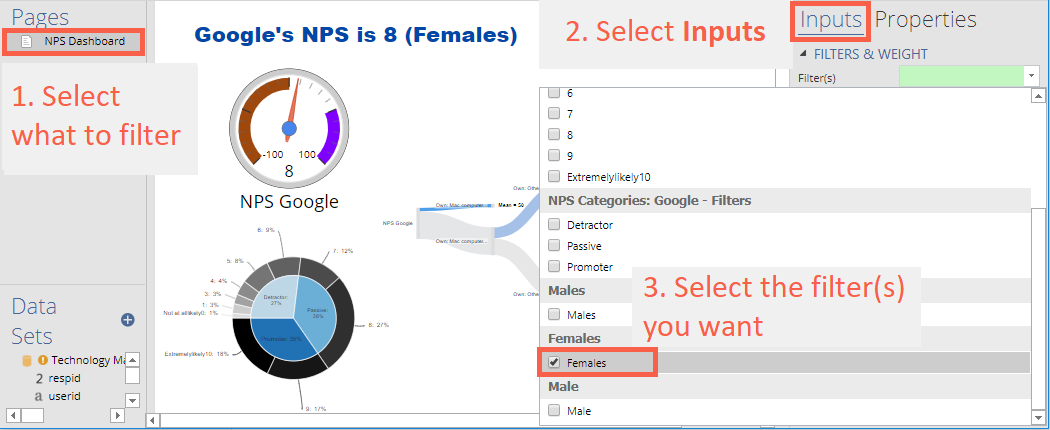
- Select whatever you want to filter. In the example above, I am selecting the entire page (from the list of pages at the top-left of the screen in Displayr.
- In the Object Inspector on the right-hand side of the screen, select Inputs > FILTERS AND WEIGHT > Filter(s).
- Choose the filter or filters that you want.
When choosing your filters, note that filters are grouped according to their variable set. Where two filters are in the same variable set, if they are both selected, it is treated as an OR operation. For example, if you were to choose Detractor and Passive from the list above, the data would be filtered to show people that are either Detractors or Passives. By contrast, where filters are in different variable sets, they are treated as AND operations. Thus, if you were to select Males and Females in the example above, the filtered data would contain nobody (as nobody is both male and female, in this data example).
You can examine this example in more detail by inspecting it in Displayr.
To learn more about all the different ways of creating filters, read the blog post 5 ways to create a filter in Displayr.