Blood Glucose Confections

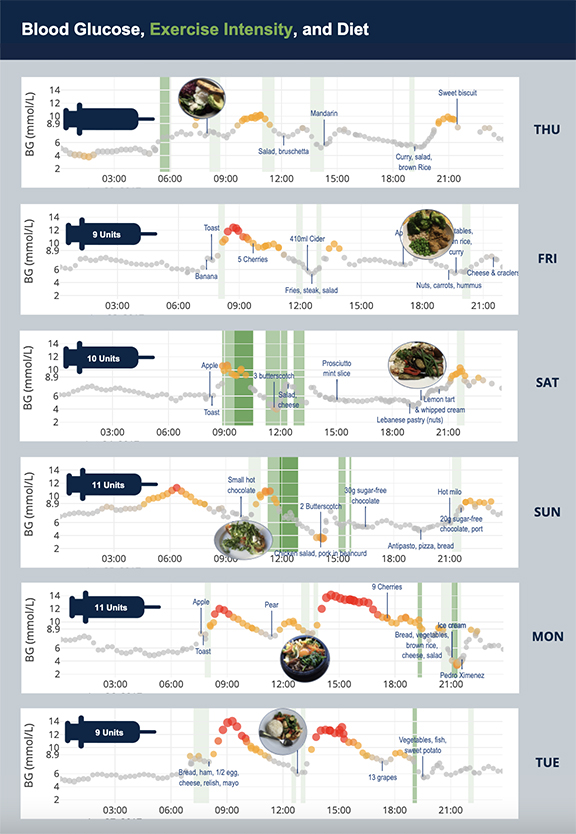
This dashboard shows a fun and innovative way to track blood glucose levels and food intake. Here we've integrated data from a wearable blood glucose implant and a food diary, providing a comprehensive view of this person's health and wellness. The underlying charts are fully automated, making tracking progress and identifying trends over time easy.

This dashboard was created in Displayr and is another example of how flexible and easy turning complex data into a fun and easy format can be. Get started with this template today (and switch it out for any data on any topic).

Get Inspired by this Blood Glucose Confections Dashboard

Blood Glucose Confections
Matt Hubbard

“Displayr is at least 50% faster than just creating a PowerPoint presentation. In some cases, I think it’s even higher than 50%.”

Matt Hubbard VP Data & Analytics, Cygnal
Cookies help us provide, protect and improve our products and services. By using our website, you agree to our use of cookies (privacy policy).
close-image

Ready to chat?
Book a time to learn more about how Displayr will cut your analysis and reporting time in half.

Book your time here
close-link