
This is a live brand health dashboard: a working example, not a screenshot. It shows a supermarket category tracker, and you can drill into any subset of the data using the filters: pick a demographic group and every chart, funnel, and table updates to match.
Explore the dashboard above – everything filters, drills, and updates.
What’s inside this brand health tracker
This brand health tracker covers the metrics most programs monitor: awareness, consideration, usage, and NPS by brand, cut by demographic group. Every chart sits on a real crosstab with significance testing behind it, the numbers a brand team can query, not just a picture of them.
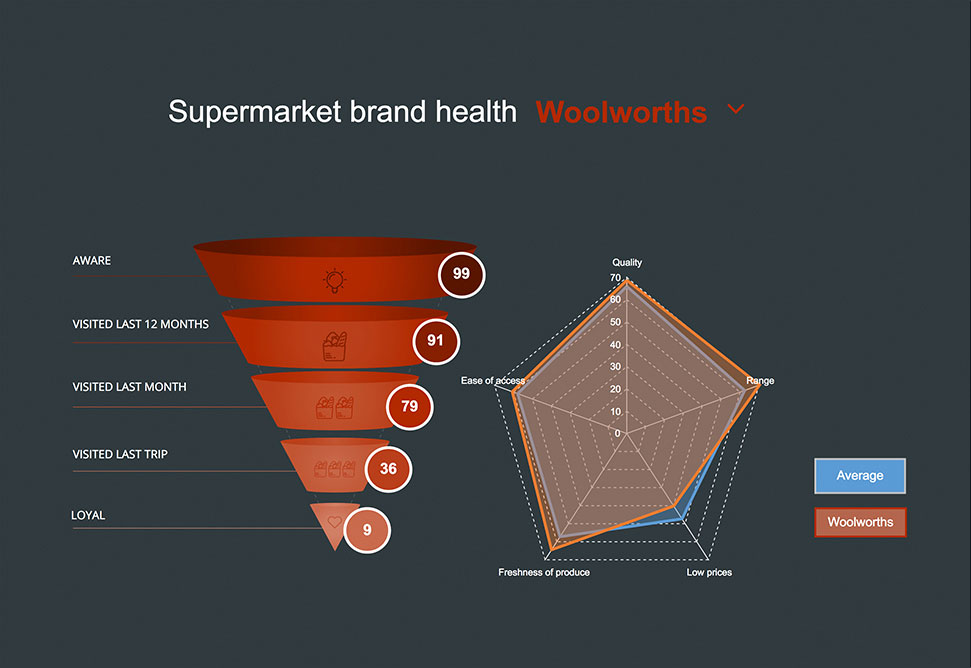
The brand health funnel
The funnel page pulls awareness, consideration, and usage into one summary view, so you can see where each brand loses people, the fastest way to understand why a brand is growing or slipping, not just that it is. Compare funnels side by side across brands, demographics, or waves.
Tracking brand health wave over wave
A brand health dashboard is only useful if it’s current. This one updates itself: when a new wave of tracker data arrives, the brand funnel, trend charts, and significance tests all refresh automatically, real-time enough for a monthly tracker, automatic enough that nobody rebuilds it. That’s what makes this format particularly handy for tracking studies.
From dashboard to brand health report
The same document also exports as a brand health report, an auto-updating PowerPoint deck for stakeholders who want slides rather than a login. One analysis, two outputs: the live dashboard for the team who explores, the report for the team who reads.
The same structure works as a product health dashboard, too, swap brands for products and the funnel, trends, and filters carry straight over.
Use this dashboard as your template
Everything here – the brand funnel, the tracking charts, the filters – is a working Displayr document, and it’s fully customizable: your brands, your metrics, your colors. Start free, connect your own tracker data, and this layout rebuilds itself around your brands.
Frequently Asked Questions
Who provides customizable brand health dashboards?
What should a brand health dashboard include?
Trusted by 2,900+ research teams worldwide

VP Data & Analytics, Cygnal
More examples
Interactive | Tracking
Interactive | Tracking
Interactive | Tracking
Interactive | Tracking