Looking to develop new products but not sure how to pull together all the data? This Decision Support Dashboard template has got you covered! It’s not just any old dull dashboard – it’s interactive, so you can take a deep dive and explore how audiences differ, what drives them, and where the greatest opportunity lies for new products.
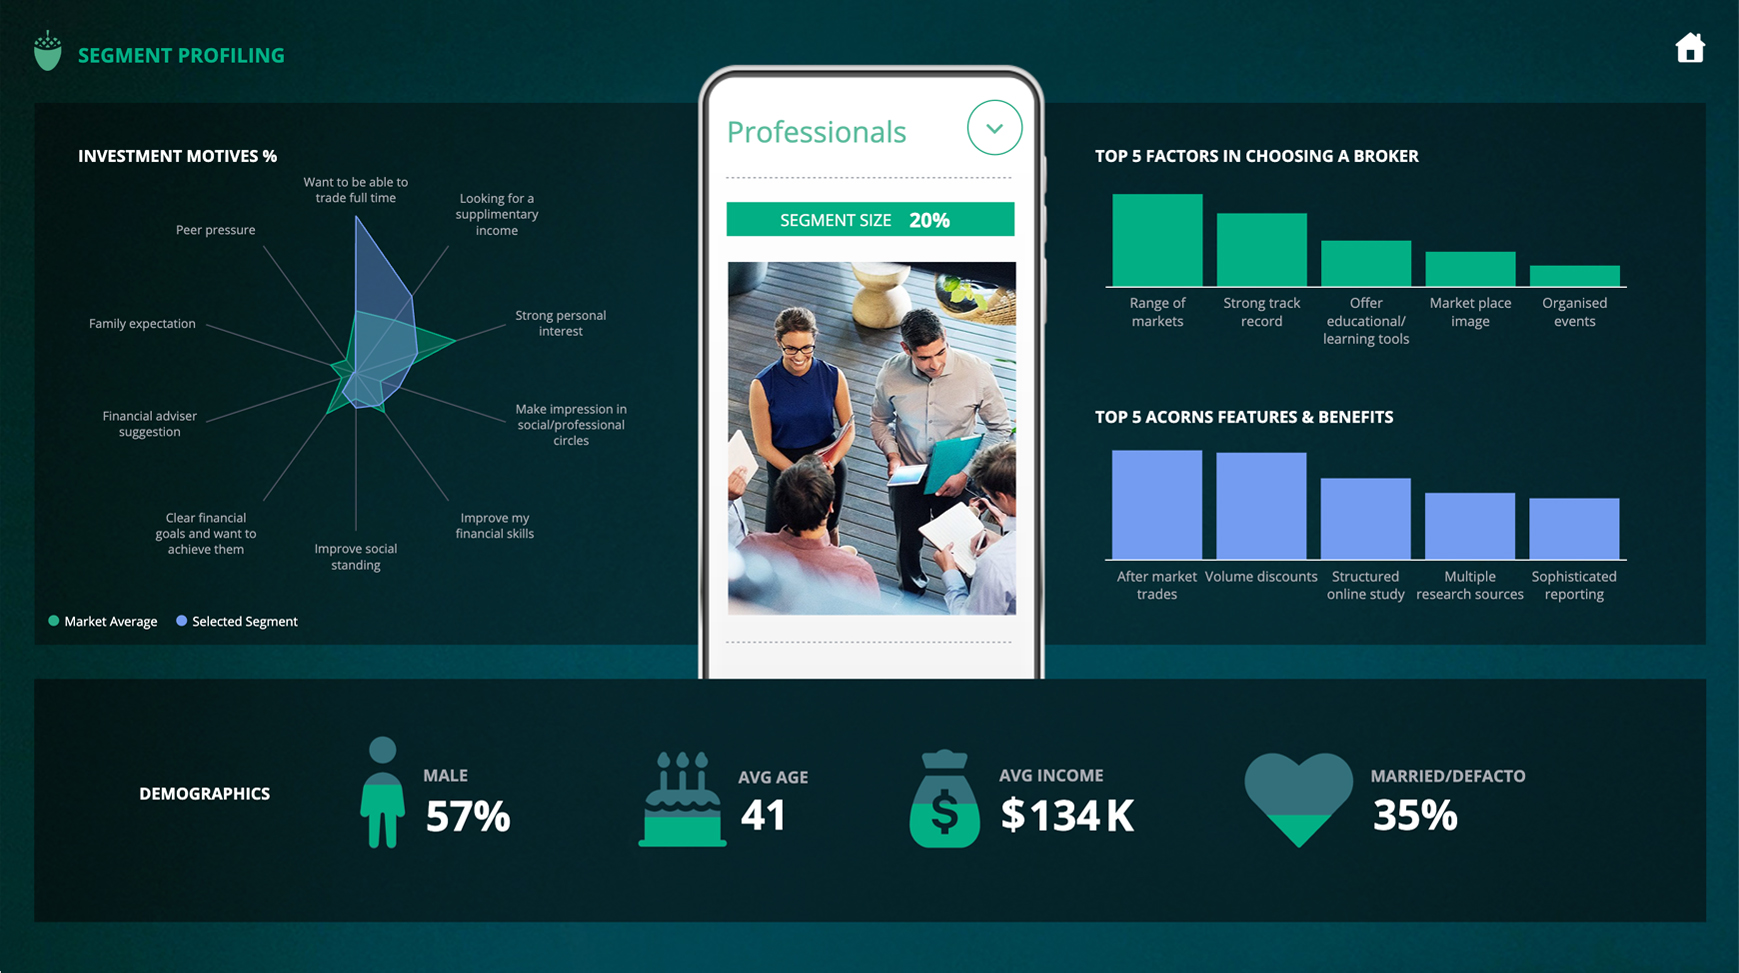
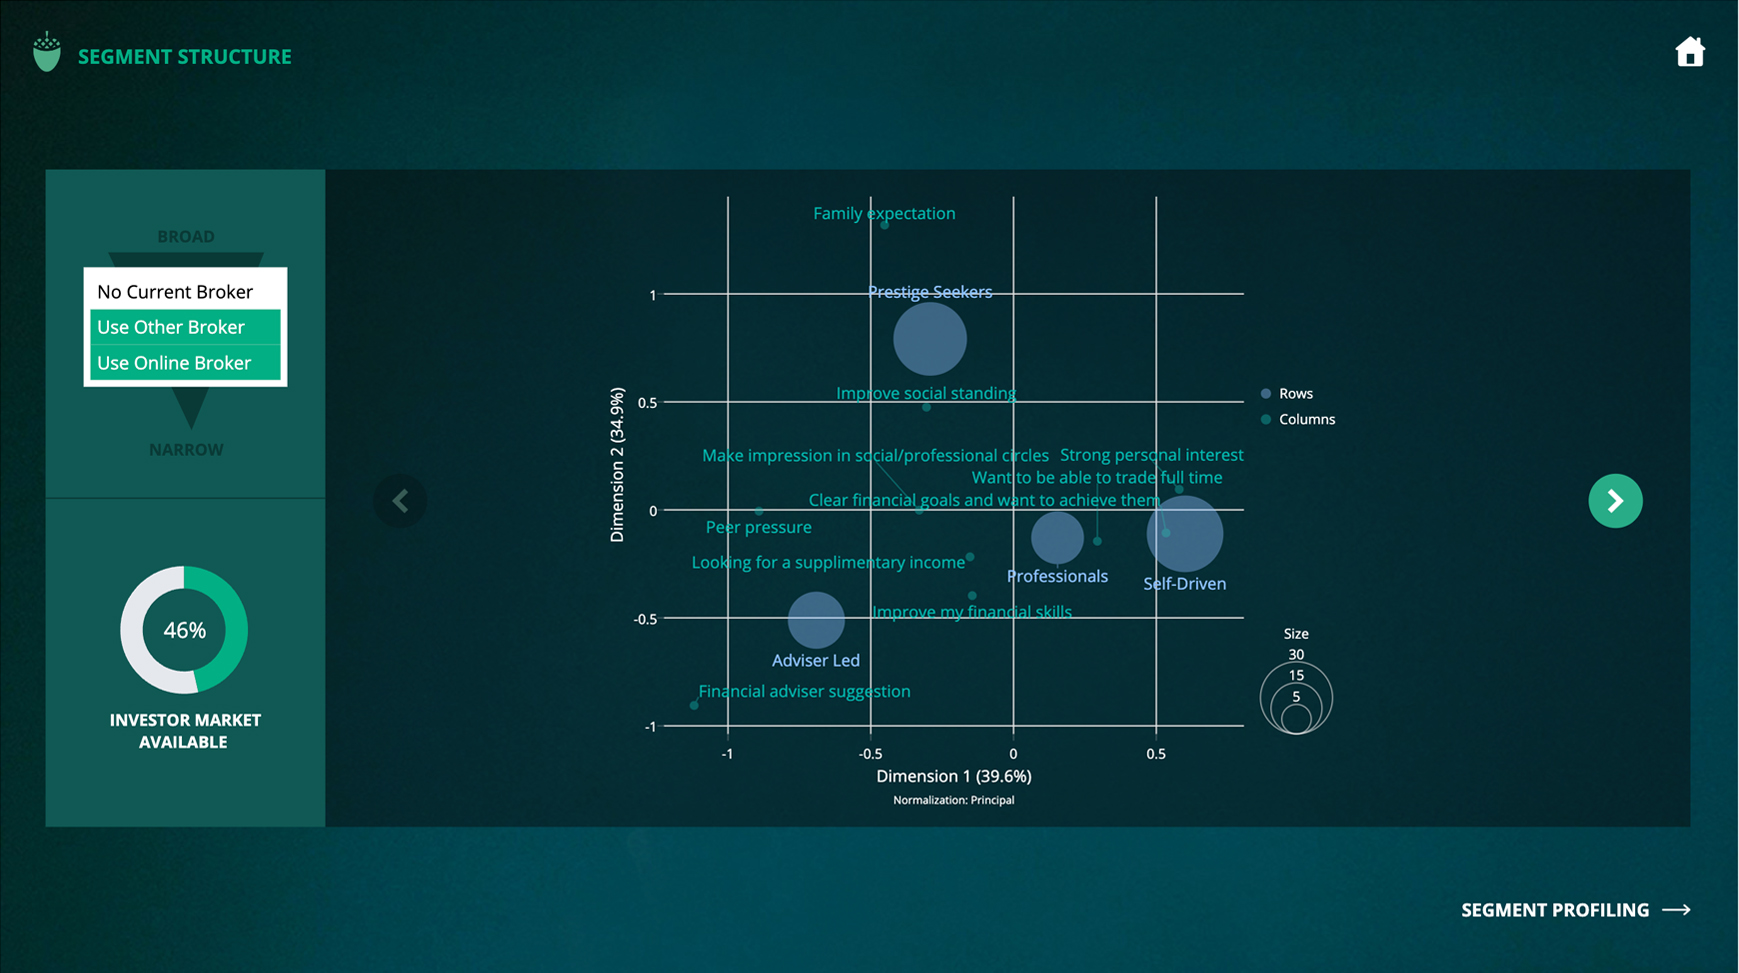
We’ve used some fancy analysis techniques, including latent class analysis to create segments, and correspondence analysis to summarize consumer motivations across those segments. But don’t worry – it’s easy to do these analyses in Displayr. We’ve also made it easy to understand the results with pictographs and pasted images. Plus, this dashboard is super user-friendly and interactive – the analysis and visualizations automatically update when filters are applied.
We’ve also given it a snazzy corporate feel with a limited color palette and the stylish Open Sans font. So whether you’re a seasoned pro or new to the dashboarding game, reports like this Decision Support Dashboard can help your clients make informed decisions and take their products to the next level. Give it a try today.