
Let’s say you are asking survey respondents for an absolute number (eg: how many colas have you consumed in the past week?) or a point on a set scale (eg: what proportion of staff are female? Please type in a number from 0 to 100). It’s not uncommon to want to band up the range of potential inputs into categories (eg: 0-5, 6-10, 11+) for analysis purposes.
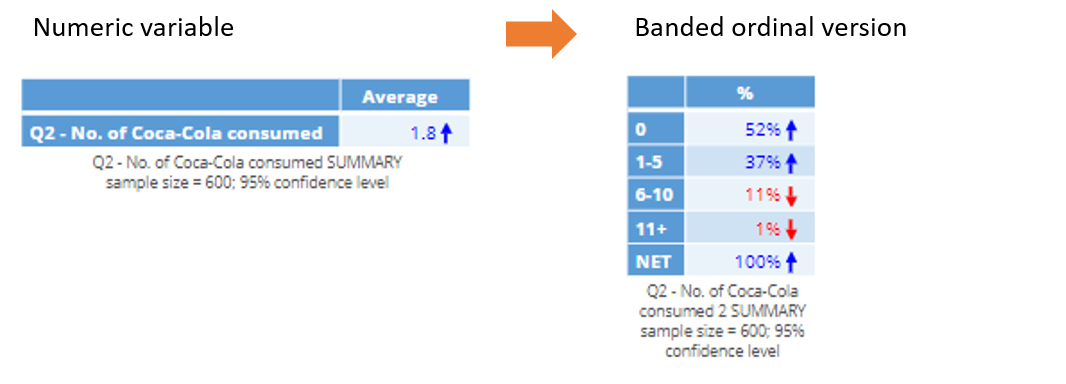
The purpose of this article is to show you the options you have for creating a banded (categorical) version of a variable, using both drag-and-drop and code methods (R and JavaScript).
Checking the Variables: Structure and Values
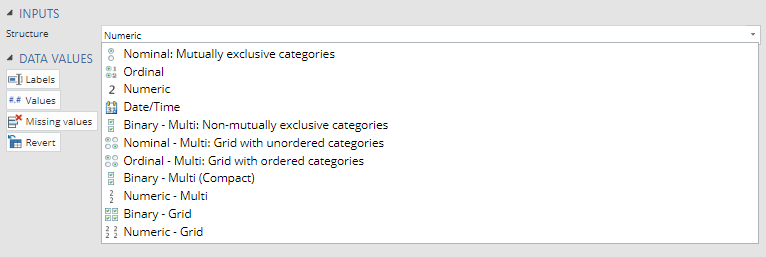
These variables I just described are normally read into Displayr as numeric variables. That is what you would expect of a good data collection platform that only accepts a numeric input. For numeric data, the values and labels are one and the same. A variable’s structure is indicated by the icon next to the variable in the Data tree, but also in its Object Inspector under INPUTS > Structure.
Displayr reads these variables as nominal or ordinal if there is text involved with the value label (eg: 0 – Not at all satisfied and 10 – Extremely Satisfied are the endpoints of your scale). If that is the case, it is prudent to check the Values so that they align correctly with the labels. The Values button is just under the Structure dropdown in the Object Inspector as per the picture above. You don’t want a value of 1 ascribed to 0-Not at all satisfied and so forth (it should be a value of 0). You should change it so that the correct value aligns with the label.
Displayr will interpret these variables as text if there are spaces or other characters involved in the data. This is one key reason why Excel/CSV files are a poor file format for survey data. If you have it as a text variable, you can change the variable structure to numeric, but it can’t be guaranteed that all non-numeric information will be correctly converted into numeric values. So you may need to manually format and clean your text variable in the Excel/CSV file (ie: remove all non-numeric characters that could be ‘polluting’ the variable).
Banding by drag-and-drop
Banding via drag-and-drop is the easiest way to band your variable and makes the most sense if you are unlikely to update your data file with new data.
If your variable(s) is numeric use Home > Duplicate to create a copy of the variable and then change the copied variable set structure to be nominal (or ordinal). As per the picture above, you change the structure in Object Inspector > INPUTS > Structure.
Drag your categorical variable on to the page to make a table. Then select all the categories you want to band together (using Ctrl or Shift) and use Data Manipulation > Merge to merge them into a category. At this point, it’s prudent to use Data Manipulation > Rename to give the banding a correct label.
And that’s it! The main drawback to using this method is that if you update your data file with fresh data (eg: more respondents) then you may end up with a category that is not in a band. For example, if you band up 1,2,3,4,6,7,9, and 10 into a band “1-10” using drag-and-drop and then if you update your data file, you may have news cases which provide a 5 or 8 score. These new values have not been included in the “1-10” band, and you’ll have to manually merge them in (by repeating the process above). To get around this, use one of the code based systems below.
Banding via R variable
Banding with code is a sure-fire method to ensuring that all potential values within a range will end up in the correct bands. It’s very simple code to implement and doesn’t require extensive R knowledge (just copy the template below). You can flexibly change the band later by tweaking the code.
Suppose your variable has the label Q2. Number of Coca-Cola consumed? It will also have a variable name (Q2_a). You can use either the variable label or name in Displayr. The variable name is revealed in the Object Inspector > Properties > General and also by hovering over the variable in the Data Set tree.
Insert > R Variable
Over in the R CODE window in the Object Inspector you can write a simple IF and ELSE IF statement. What I like about R CODE is that you can drag a variable from the Data Sets tree directly into the R Code box, and give it the convenient label ‘x’ (or whatever). So the first line of code looks like: x = `Q2 - No. of Coca-Cola consumed`
Then you can easily set up your bands referring ‘x’, like the below:
x = `Q2 - No. of Coca-Cola consumed
x[x = 0] = 0
x[x >= 1 & x <= 5] = 1
x[x >= 6 & x <= 10] = 2
x[x > 10] = 3
x
You can augment and adjust the code above to suit your banding needs, adding as many lines as you like. See here for a guide to IF and ELSE IF statements in R.
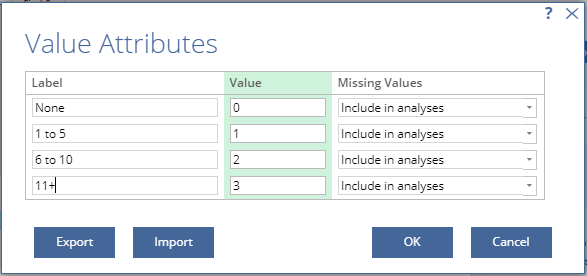
In the above, I’ve given the new bands values of 0,1,2, and 3 respectively. You could make these whatever you want. Once you’ve made the variable you will need to adjust the label for each Value, which you can do by going to the Values Attributes window using the Values button in the Object Inspector.
Banding via JavaScript
For those of you who prefer to use JavaScript, the process is very similar to the R variable, except of course you use JavaScript, so the code is a little different. It uses IF and ELSE IF statements. In the above, you can drag-drop and/or us the variable label in the code. With JavaScript, you need to use the variable name, as per the first line of the code below. The variable name is revealed in the Object Inspector of the variable (under Properties) and by hovering your mouse over the variable in the Data Set tree. So your code could look like this:
x = q2a_1
if (x == 0) 1;
else if (x >= 1 && x <= 5) 2;
else if (x >= 6 && x <= 10) 3;
else if (x > 10) 4;
Try for yourself
The examples in this post are in this Displayr document. The variables are at the top of the Data tree.