

Traditionally, the primary statistic of interest for categorical data is the percentage of the cases in the data that fall into each category. However, there are a range of cases where it is useful to calculate an average value based on the categories. This requires that each category in the data be associated with a meaningful value, so that the average is also meaningful. In this article we consider cases which feature prominently in survey research. The first is the rating scale (or Likert scale) which has a natural numeric sequence associated with it, owing to the ordered nature of the categories. The second example is the case where a survey question asks the respondent to choose a range of values to which they belong, like age groups or income brackets.
Scale Questions
Market researchers commonly utilize ordinal scales for questions such as satisfaction, agree/disagree statements, likelihood to recommend, and many others. While these scale categories are useful when showing response percentages for each scale category, often, it is much more practical to show an average overall rating. The average rating provides a single metric which is more easily interpreted than trying to interpret the response percentages for each individual scale category.
For scale questions, the key to calculating an average is to program the survey with meaningful values coded to each individual scale category. For example, take the following satisfaction question which has been coded with 5 for “Extremely satisfied”, 4 for “Satisfied”, and so on.
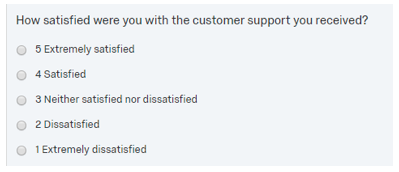
The results for this question can easily be averaged. The closer the overall average is to 5, the higher the level of satisfaction. Using the average also allows for easy crosstab comparison of sub-groups.
Different scales can be used as well depending. Whereas the above example uses a 1 to 5 scale, this could just have easily used a 0 to 100 scale.
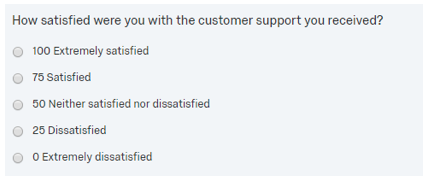
This approach can be applied to virtually any scale-type question from which average can be easily derived.
If the data collection program does not associate the categories with meaningful values, then values can usually be recoded in whichever tools is being used to analyze the data.
Numeric Questions
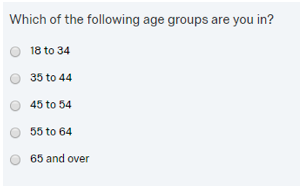
For some numeric questions, researchers will often utilize categorical, single-response options with numeric range labels rather than ask respondents to enter a specific value as a response to a question. For example, the respondent’s age is commonly asked as a categorical value range than as a numeric question.
So why not simply ask for and allow the respondent to enter an exact numeric value since this would obviously be the most accurate possible response? There are a few of different reasons for this:
- Data consistency – using categorical ranges assures that all responses are consistent and no additional data cleaning is needed. This also eliminates the need for validation in the survey programming to ensure proper numeric values are entered.
- Ease of response – it is often easier for the respondent to simply check an option of ranges rather than enter an exact value into a text box.
- Respondent comfort – some respondents may not be comfortable providing exact numeric values, such as age or annual income or other health-related metrics. There respondents are more likely to simply select a broader category, thus making the overall survey experience feel less intrusive.
Researchers inevitably will still want to be able to calculate an average from these types of questions even though respondents are providing categorical responses rather than actual numeric values. The way to achieve this is with midpoint coding.
Midpoint Coding
Take the above single-response age question response option categories as an example. Unless programmed explicitly, many survey platforms will automatically assign incremental numeric codes starting at 1 for each of the categorical values. In the example above, the ‘18 to 34’ category would be coded as a 1, the ‘35 to 44’ response option is coded as 2, and so on. While this is obviously useful for data tabulation purposes, these values are not particularly useful for calculating an average.
The way to achieve this would be to instead use a midpoint value of each of the response ranges as follows:
| Range | Original Code | New Code |
| 18 to 34 | 1 | 25 |
| 35 to 44 | 2 | 39.5 |
| 45 to 54 | 3 | 49.5 |
| 55 to 64 | 4 | 59.5 |
| 65 or more | 5 | 70 |
Note that the value for the last option is somewhat arbitrary as there is no real upper limit to the range. Judgement must be used to choose a sensible value for the highest category. One rule is to halve the previous interval (in this case 10/2 = 5) and add that to the number in the label.
Another example would be a household income question with the following response options:
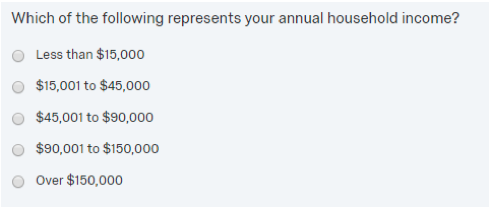
In this case, to be able to calculate an average household income, rather than using values or 1-5, the category values would be coded with income range midpoints:
| Range | Original Code | New Code |
| Less than $15,000 | 1 | 7500 |
| $15,001 to $45,000 | 2 | 30000 |
| $45,001 to $90,000 | 3 | 67500 |
| $90,001 to $150,000 | 4 | 120000 |
| Over $150,000 | 5 | 176250 |
By using these midpoints as the categorical response values, the researcher can easily calculate averages. Granted, this average will only be an estimate or a “ballpark” value but is still extremely useful for the purpose of data analysis.
It is also worth noting that using more categories (and therefore smaller ranges) will result in a more accurate average as there will be less deviation from the actual value within these smaller ranges.
Common Pitfalls to Watch For
While averaging scale or categorical data can be incredibly useful, it’s not always the most appropriate way to summarize your results. Misinterpreting these averages can lead to oversimplified or even misleading conclusions.
-
Uneven category widths: When ranges aren’t evenly spaced (e.g., “Less than $15,000” vs. “$15,001–$45,000”), midpoints might skew the average and misrepresent the true distribution.
-
Skewed response patterns: Averages can hide important patterns in the data. For example, if half of your respondents chose “Extremely dissatisfied” and the other half “Extremely satisfied,” the average might suggest a neutral sentiment—when in reality, opinions are polarized.
-
Non-interval scales: Not all ordinal scales are created equal. Assuming that the distance between “Agree” and “Strongly Agree” is the same as between “Neutral” and “Agree” can be risky if the scale hasn’t been tested or validated.