You’ve found an odd result in your analysis, and you want to dive deeper into your data set to try and understand the pattern. Displaying the values from the variables that you are analyzing in a Raw Data Table can allow you to get to the bottom of what’s happening with your data. The table will allow you to filter and sort the data by values in any column.
To create a raw data table in Displayr you can:
- Select Insert > More > Tables > Raw Data
- In the Object Inspector on the right, select the variables that you want to analyze in the Variables box by either clicking and dragging them from Data Sets, or by clicking into this box and making selections.
- Tick the Automatic box at the top. This ensures that when your data changes or you change your selections then the raw data table will update its contents automatically.
For example, I’ve run a survey and I have asked my respondents to tell me which age group they belong to. When I created my survey I included 10 age groups, but later decided that this was too many. I asked my data supplier to group these into 3 larger age groups – not knowing that I could do that easily in Displayr myself! Let’s say that I’ve got some concerns about the way the supplier has done their job and want to check that the respondents in the old age groups have been correctly assigned to new groups.
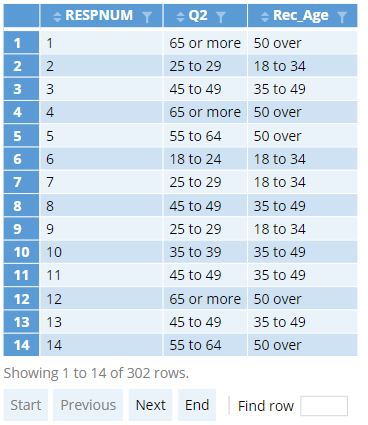
To check the data, I create a raw data table showing the ID’s of the people in the sample (RESPNUM), the original age groups (Q2), and the new age groups (Rec_Age). The table would look like this:
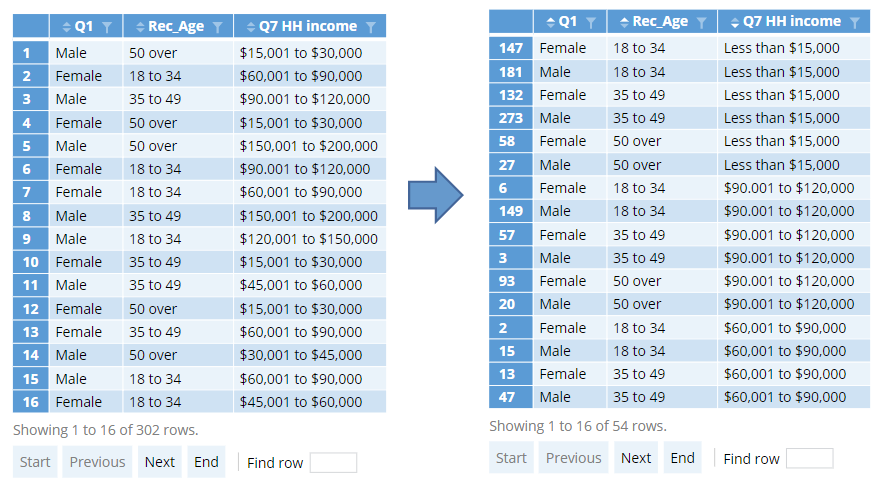
The initial output shows the raw values for all cases in the data set in the order in which they appear in the data. You can use the funnel button at the top of any column to filter the table to one or more values (just like filtering columns in an Excel table) and you can sort using the triangular arrows. If I find a mistake in the raw data, I can tell my supplier which respondent IDs are wrong and get them to correct the errors.
How do different types of data appear?
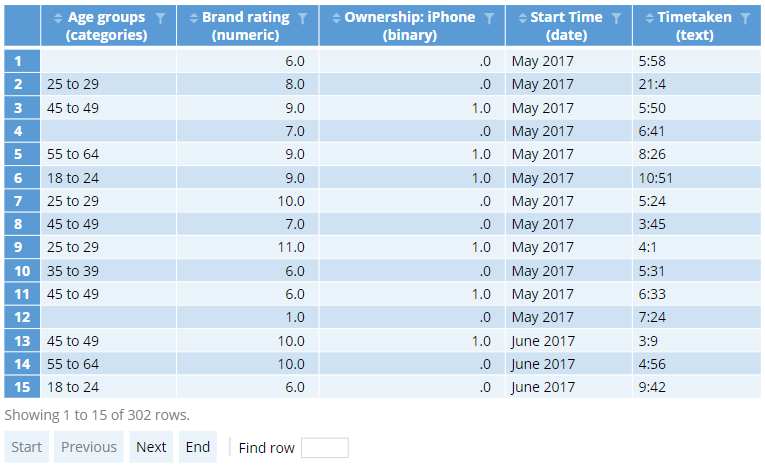
The raw values for a variable will appear differently depending on the variable set structure. Here’s an overview of how things will appear for different structures. To learn more about structures in Displayr, check out this article. For all data types, Missing Data will appear as blank cells in the table.
Categories
The labels of the categories will be displayed. If you have merged categories or renamed them, then these changes will be shown in the raw data table. This applies to variables from variables sets with structure Nominal, Ordinal, Nominal – Multi, and Ordinal – Multi.
Numeric data
When a variable is from a variable set with structure Numeric, or Numeric – Multi, or Numeric – Grid, then the raw numbers associated with each data point will be shown.
Binary data
Variables from Binary – Multi variable sets will show numeric values of 0, 1, or blank.
Dates
When you include a Date variable in a raw data table then it will display the date periods according to the aggregation that has been chosen for the date. For example, if your date variable is aggregated monthly, then the raw data table will show the month for each observation. This aggregation is changed by selecting the date variable under Data Sets and choosing Properties > INPUTS > Date/Time in the Object Inspector.
Text
When you include a Text variable, then you will see the exact values for each case.
Using raw data for calculations
It’s sometimes convenient to use a raw data table as an input to calculations in R (although if you are doing statistics it’s usually better to use Displayr’s built-in statistical engine if you can). As always, to use a table in a calculation you need to refer to it by name, and the name is found by selecting the output and checking Properties > GENERAL > Name in the Object Inspector. The table will be available as a data frame when used in an R calculation.
As a simple example, say I want to work out all the unique combinations in a collection of demographic variables. I create my raw data table as above, and then:
- Select Insert > R Output.
- Work out the Name of my raw data table as above (in this case it is raw.data.2).
- Write my code to use that table, for example: unique(raw.data.2)
- Click Calculate.
The resulting table will show all the unique combinations of my three variables.