


This post describes how to apply the three standard ways of scaling (transforming) rating scales data prior to using cluster analysis and other algorithms for forming segments: standardizing within variable, standardizing within case, and unit scores within variable. The post starts with a discussion of the reasons for scaling. Then, it reviews the three standard ways of scaling. Then, there’s a discussion of some other common ways of transforming data prior to creating segments. The post ends with a discussion of how to validate segmentations after scaling.
Why data is scaled
Segmentation algorithms, such as k-means, attempt to create groups that optimally summarize the strongest patterns in the data. However, sometimes the strongest patterns in the data are not very useful. In particular, three common problems are:
- A small number of variables dominate the segmentation. For example, if one variable has a range of 11, and the others all have a range of 1, it’s likely that differences on the variable with the large range will dominate the segmentation. This problem is addressed by scaling variables.
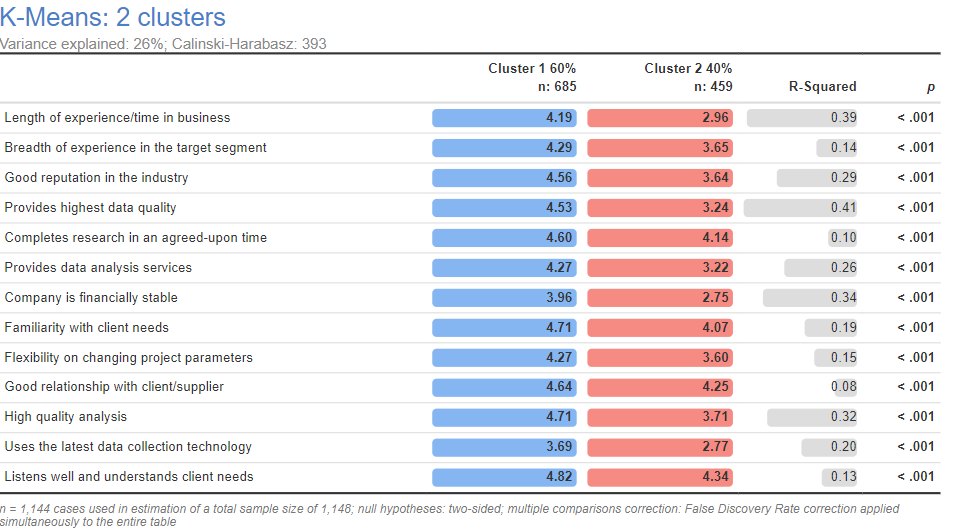
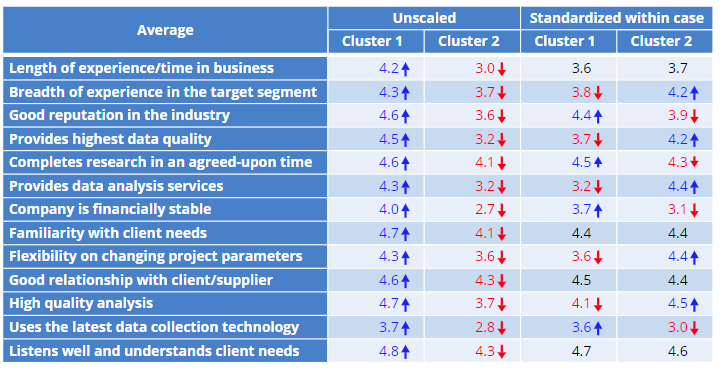
- Patterns consistent with response biases are identified. For example, the segmentation below is based on ratings of how important people believe different things are to buyers of market research services. Two clusters are shown. The average for cluster 1 is higher on every single variable than cluster 2. One explanation is that cluster 1 just regards everything as more important. The more likely explanation is that cluster 1 consists of people who have a tendency to give higher ratings (i.e., a yeah-saying bias). This problem is addressed by scaling within case.
- The segments are just not interesting/useful, and there is a desire to obtain segments that are in some ways different. Some people new to segmentation are a bit surprised by this goal, as they often have a misunderstanding that segmentation is about “finding” segments in data. However, segmentation is more about “creating” segments. There are numerous arbitrary decisions that go into segmentation, and each reveals some different aspect of the underlying data. The goal is to find the segmentation that is most useful.
The three common ways of scaling
Standardizing data, in the context of clustering and other segmentation techniques, usually refers to changing the data so that it has a mean of 0 and a standard deviation of 1.
Standardizing within variable
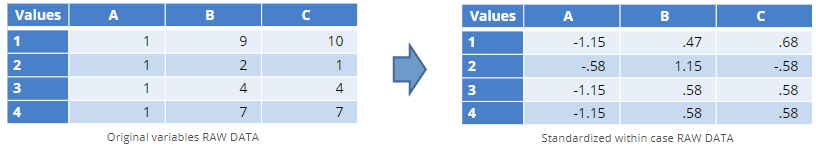
The toy example below shows a data set containing 4 observations (variables) and three variables. Variable A will be ignored by any sensible segmentation algorithm, as it has no variation. But, all else being equal, a segmentation algorithm will be more likely to generate segments that differ on variable C than B. This is because C has a higher variance (standard deviation) than B. A fix for this problem is to modify each variable so that they have the same standard deviation. The simplest way of doing this is to subtract the mean from each variable and divide by the standard deviation, as done on the right. In Displayr, this is done by selecting the variables or variable set and clicking Object Inspector > ACTIONS > Scale within variable – standardize or by selecting this option from Insert > Transform.
Note that after this scaling variable A contains entirely missing data, and needs to be excluded from any segmentation.
Standardizing within case
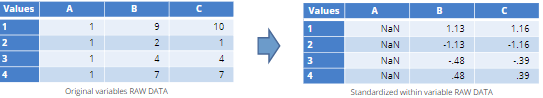
Both before and after standardizing within variable, variables B and C are highly correlated (the standardization does not affect their correlation). When most of the variables are highly correlated it guarantees that the resulting segments will primarily differ in terms of their average values. Standardizing within case means scaling each case (row) of the raw data so that it has a mean of 0 and a standard deviation of 1. In Displayr, this is done by selecting the variables or variable set and clicking Object Inspector > ACTIONS > Scale within case – standardize or by selecting this option from Insert > Transform.
Compare the data for cases 3 and 4. In the original data, case 4 has values of 1 and 7, whereas case 3 has values of 1 and 4. After the scaling, cases 3 and 4 are now identical. Also note that variable A previously contained no information, but it now does contain variation, as case 2’s score of 1 on A is, by this case’s standards, nowhere near as low a score as it is for the other cases.
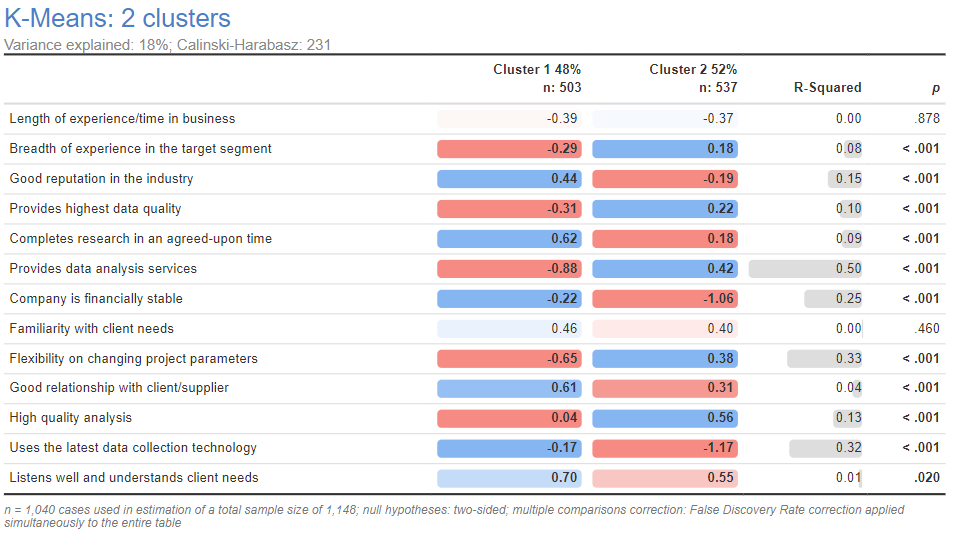
The output below shows the two-cluster solution for the market researcher data after standardizing within case. The yeah-saying bias has been removed.
Unit scaling within variables
An alternative to standardizing within variables is to scale the data to have a unit scale, which means a minimum value of 0 and a maximum value of 1. This form of scaling is most useful when the input data has different scales (e.g., some variables may be on 2-point scales and others on 9-point scales). In Displayr, this is done by selecting the variables or variable set and clicking Object Inspector > ACTIONS > Scale within variable – unit or by selecting this option from Insert > Transform.
Other scalings
Other transformations
Any transformation of variables can be used as a way of preparing data prior to using a segmentation algorithm, such as logarithms, rankings, square roots, and top 2 boxes, to name a few. These are available in Displayr via Insert > Transform and by clicking Object Inspector > ACTIONS.
Dimension reduction
Another popular approach to scaling data is to use dimension reduction techniques such as principal component analysis/factor analysis, and multiple correspondence analysis.
Multiple scalings
It is not unknown to apply multiple scalings in sequence. For example, first standardizing within case and then within variable, or, the other way around.
Validating scalings
Ultimately, any approach to scaling the data is arbitrary and as such it may improve things, or make them worse.
Evaluating differences with the raw data
The most fundamental check is to check the resulting segmentation using the original, untransformed variables. The first two columns of data in the table below just repeat the initial segmentation from near the beginning of this post. The columns on the right demonstrate that the segments formed using data standardized within case are different even when compared using the original data. This is both important as a check for validity and also important for reporting (as showing results using scaled variables is a sure-fire way of confusing end-users of a segmentation).
Comparing to other data
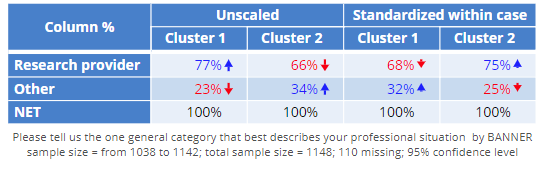
A second way of validating the scaling is to check that the segments are correlated with other variables. For example, the segments formed with the standardized data do predict differences in whether somebody is a research provider or not, which demonstrates that the segments are not merely “noise”.
General usefulness
The last key consideration when evaluating a scaling is the most important: is the resulting segmentation useful for the purpose for which it has been created?
For more information about how to perform segmentation, see our webinar and our eBook.