

It is super-simple to create a table involving one variable in Displayr: just drag it from Data Sets (bottom-left) of the screen onto a page, and tables are automatically created. Making a table involving a second variable is also simple: drag a second variable on top of the table, releasing it in the Columns or By fields. Not surprisingly, many people think that a third variable should be able to be added by dragging it onto the first two, but this does not work! If you are familiar with business intelligence apps, such as Tableau, this will seem strange. This post describes how to create tables using more than two variables. I also explain the logic behind the unusual treatment of the third variable in Displayr.
Creating filters
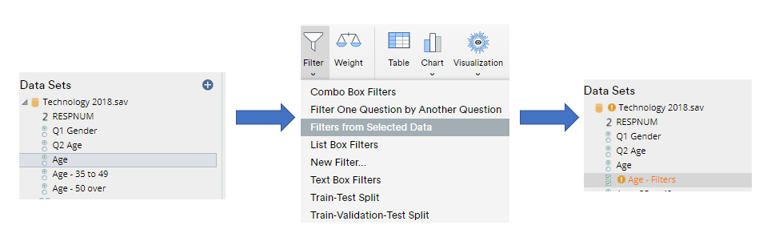
The simplest way to bring additional variables into play is by filtering the data. This restricts the analysis to a subset of the available data. Any table created by dragging and dropping from Data Sets can be filtered. To create filters in Displayr, select the data that you wish to use under Data Sets (e.g., hold down the Ctrl key on your keyboard and select the data from the bottom-left of the screen), and select Insert > Filter > Filters from Selected Data.
Applying filters
Apply filters by selecting an output and then select from the Filter(s) dropdown box in the Object Inspector. The filter is applied to the selected output. To apply a filter to multiple outputs at once, hold down your Ctrl key, select each output and then select a filter from the Object Inspector.
Details of the filters appear in the footer at the base of any table (or chart) that has been created by dragging and dropping from the Data Sets tree. If you want to play around with the data and filters in the example shown below, click here. Please read 5 Ways to Create a Filter for more information about filtering.
Creating a table with lots of variables
You can create tables with an unlimited number of variables by selecting Insert > Analysis > More and then selecting Tables > Multiway Table. For example, the table below shows Average monthly bill by Occupation, Work Status, and Gender.
Although the table below looks similar to the one above, they are very different in terms of functionality. When a multiway table is created, you can still apply filters as described above, but you can also press the buttons on either side of each heading to sort and filter data within the table itself.
A drawback of the multiway table is that it does not have a footer. You can create one by selecting Insert > R Output and pasting in the following code into Properties > R CODE
sample.size <- if (length(QFilter) > 1) paste0("n: ", (sum(QFilter))) else ""
paste0(attr(QFilter, "label"), "n", sample.size)
Remember if using this approach to describing your filter, that filters are only applied to whatever is selected. If you want to filter a table and have that filter description appear in the text, make sure you have selected the entire page before applying the filter. Click here to play with this example.
Another method of creating a 3-dimensional table is to use Insert > Filter > Filter One Question By Another Question. The advantage of this approach is that it creates new variables in your data set so you don’t lose the built-in table functionality. See Easy Functions for Automating Filters and Rebasing for further details.
How to Make a Table with 3 Variables
As mentioned, creating a table with three variables adds an extra layer of complexity compared to the standard two-variable (rows and columns) setup. With three variables, you typically need to introduce a third dimension—commonly displayed as separate tables, layers, or panels across a page.
Some best practices to consider when working with three variables in a table include:
- Nested Tables: One variable is nested within rows or columns to show more detailed breakdowns.
- Faceted Views: The third variable is used to create separate tables or charts for each category (e.g., by gender or region).
- Combined Grouping: Two variables are merged into a single composite variable for rows or columns.
The best choice depends on your goals – clarity, comparability, or depth of analysis. Avoid clutter by only including combinations that add real insight.
Using Variable Sets to analyze lots of related variables
Displayr has another, completely different, approach to performing analyses with lots of variables. This is via Variable Sets. For example, 63 raw variables and 17 constructed variables form the basis of the table below! Please check out Understanding Variable Sets in Displayr: A Tutorial for more information.
Excel table with 3 variables
To create a distance matrix from raw data, you often start with an Excel table with 3 variables – for example, ID, X, and Y coordinates. This format is common when preparing data for calculating distances between points.
If you’re trying to figure out how to make a table in Excel with 3 variables, simply enter each variable in its own column, one row per item. This structured format can then be used to compute distances using formulas or exported to analysis software.
Key differences between a Data Science and a BI/Database analysis workflow
As mentioned in the introduction, if you come from a business intelligence (BI) background it may seem rather weird that you just cannot keep adding variables to a table by dragging and dropping. The basic reason is this: the BI approach only works with simple types of data. The approach used in Displayr is applicable to more complex workflows.
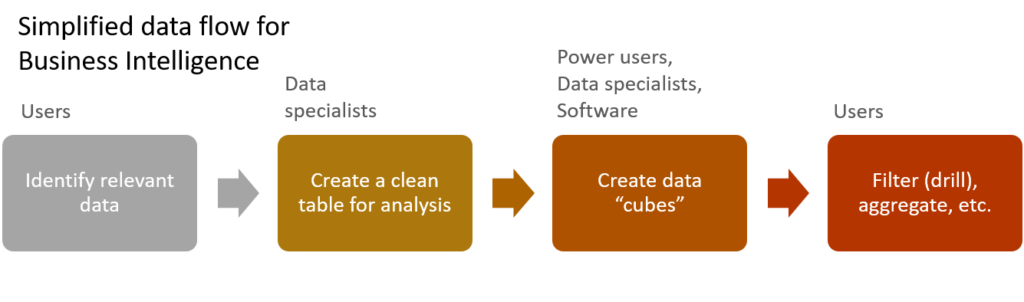
The classic BI workflow consists of multiple people drilling into data over a series of stages. Users initially give input into which data they require. Data specialists then create a purpose-built table, created by joins from multiple tables and data sources. Data hypercubes (e.g., OLAP cubes) are created, and users spend most of their time manipulating these cubes. This is done by drilling into them (filtering), aggregating, creating indexes, etc.
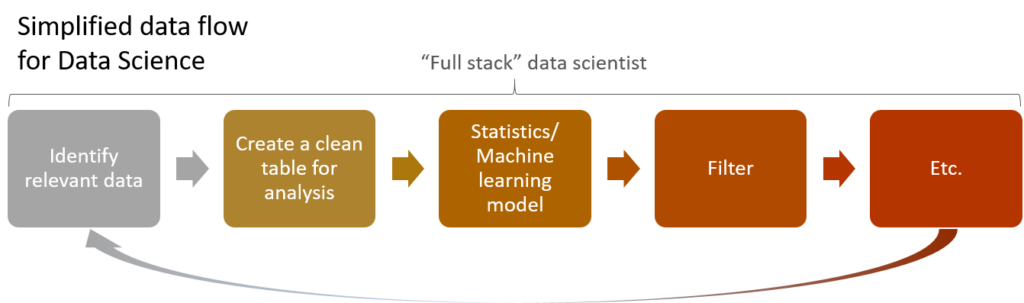
At a superficial level the data science workflow looks very similar to the BI workflow. Relevant data is identified, data tables are created, and analyses are performed. However, the first big difference is that many data scientists works across the “full stack”. Most of the glory of a data scientists role comes when applying machine learning and statistics. To get to that stage of the analysis, they spend between 60% and 95% of their time identifying and cleaning relevant data. They tend to do this in an iterative fashion and simultaneously with interrogating the data. Check out Understanding Variable Sets in Displayr: A Tutorial to get a primer on some of these tools.
A second big difference relates to the application of filters. In a BI world, it is useful to think of the data as a “cube”. For example:
sales = sales * geography * firm size = (product A sales + product B sales) * (US + International) * (Small firms + Big Firms).
At a computational level, “drilling” into the data involves removing elements of the cube. For example, to look at the data for Big Firms we exclude the data for small firms. If the BI platform has a nice user interface, we can likely perform this operation by just clicking on a button or heading called Big Firms, and the program figures out what we are trying to do.
In a data science world, however, the analyses tend to involve many, many, more variables. A decision tree predicting whether or not somebody will have a baby in the next 12 months may use hundreds or thousands of different variables as predictors, such as age, gender, purchase histories, state, geocodes, etc. While we may want to filter and re-run such an analysis based on a subset (e.g., ethnic minorities), in general the number of variables is too large for it to be practical to show all of them as buttons on a screen, and often we will want to filter using a variable that is not even in the analysis. For these reasons, filtering in data science apps uses a completely separate mechanism, as I explained above. Please read 5 Ways to Create a Filter for more information about filtering.