


Displayr has lots of tools designed to simplify data analysis. At the core of these tools is the concept of a variable set. The idea of a variable set does not exist in standard Business Intelligence or data analysis apps, and it is central to how Displayr works, so please be a bit patient and read this post all the way to the end!
This post is structured as a tutorial. I recommend that you login to Displayr here and work your way through the steps in the tutorial. There is a good chance you are going to miss something if you just skim read this post.
Click here for an interactive tutorial on Variable Sets
Overview
As the name suggests, a variable set is a group of one or more variables. These sets form automatically when you import a data set into Displayr. You can also manually define a variable set. Variable sets are the magic behind the following key Displayr features:
- Automatic creation of tables. In Displayr, a table is created by dragging and dropping variable sets. Displayr figures out how to create the table based on the properties of the variable set (e.g., whether to show percentages or means, which categories to merge, how to order the data).
- Automatic creation of charts. This is basically the same as with tables.
- Automatic statistical testing. Displayr automatically performs statistical tests on the cells of tables using the variable set information to work out which of dozens of tests to perform, as well as how to correct for multiple comparisons (if selected).
- Automation. When you modify the properties of a variable set, Displayr makes the modification to all other analyses that use this variable set. This includes things that you have automatically created, as well as those that you will create in the future (e.g., new tables, importing revised data).
The table below summarizes the various ways of modifying variable sets. It may not make a lot of sense until you have read the rest of the post, but will hopefully be a useful reference piece thereafter.
| Group variables into a variable set | This is done automatically when you import data, and by Data Manipulation > Variables > Combine |
| Duplicate a variable set | Home > Selection > Duplicate |
| Split apart a variable set | Data Manipulation > Variables > Split |
| Restructure a variable set (e.g., from a grid to a column, from percentages to an average) | Select the variable set, and use Properties > INPUTS > Structure (on the right of the screen) |
| Recode values | Select the variable set from the Data Sets tree, then Properties > DATA VALUES > Values |
| Hide categories or changing missing value settings | Select the variable set from the Data Sets tree, then Properties > DATA VALUES > Values |
| Change the order of rows/columns | Drag and drop + Data Manipulation > Rows/Columns > Sort |
Case Study: survey data on the colas market
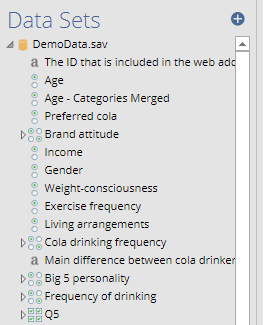
When importing a data file into Displayr using Home > Data > New Data Set, Displayr automatically converts it to a Data Set. A Data Set is shown on the left-hand side of the screen in the Data Sets tree. You can see that the name of the Data Set is DemoData.sav, which is also the name of the data file that was originally imported.
Each item underneath DemoData.sav constitutes a variable set, which contains one or more variables.
Creating a table from a variable set
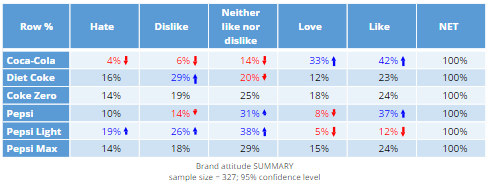
When dragging a variable set from Data Sets to the page, a table gets created. The table below is a summary table of the variable set called Brand attitude. If you have some experience using data science apps like SPSS, SAS, or R, there is a good chance that this table will come as a surprise. Displayr automatically decided to show percentages, without anyone telling it to do so. Furthermore, it shows attitudes towards six different brands in a two-dimensional structure.
The specific name of this variable set structure is Nominal – Multi, which you can see under Properties in the object inspector on the right-hand side of the screen. Each row of the table represents a nominal variable (i.e. a variable where the categories are mutually exclusive and exhaustive). Each column represents a particular category that applies across all of the variables.
Looking at the Raw Data
The best way to start to understand what has happened is to select the table (if not already selected), and change the By setting on the right-hand side of the page from SUMMARY to RAW DATA (in the Inputs tab). The resulting table has 327 rows, and shows 6 variables (i.e. columns). Each of these variables corresponds to one of the rows of the previous table. The second variable, for example, shows the raw data for Diet Coke. Where the earlier table shows that 16% of people Hate Diet Coke, this corresponds to the proportion of -2 values that appear in the Diet Coke columns. Similarly, the -1s correspond to the Dislike percentage in the first table.
Viewing the properties of the Variable Set in the Object Inspector
Select Brand attitude in the Data Sets tree. Move your mouse to the left of Brand attitude and press the small triangle, which will expand out to show you all the variables in the Variable Set. In this case there are six.
In the Object Inspector’s Properties tab shown on the right-hand side of the screen, note the button called Values. Press this button. It shows you the meaning of the numbers in the raw data. You can also change the values here by editing these cells.
Duplicating a question
- Insert a new blank page (Home > Page Layout > New Page > Blank)
- Drag the Brand attitude variable set to the top of the page.
- Click the Brand attitude variable set in the Data Sets tree again. Then, press Home > Selection > Duplicate.
- Under Properties > GENERAL > Label change it to Brand attitude – Numeric. Note that a new variable set has appeared in the Data Sets tree.
- Drag the new variable set onto the bottom of the page, taking care not to release it over the table that you earlier created.
Changing Variable Set Structure
You should now have two tables that appear entirely identical on the page. However, they differ in a very important way: each one is linked to a different variable set.
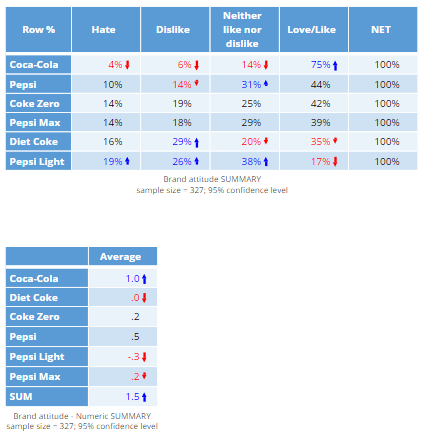
In the Data Sets tree, select Brand attitude – Numeric and change its Structure to Numeric – Multi (Properties > INPUTS > Structure, on the right-hand side of the screen).
Changing the structure of the variable set has caused both the overall appearance of the table to change so that there is now only one column. It has also changed how the data is summarized, now showing averages instead of percentages.
This emphasizes some aspects of how Displayr works:
- The variables in a data set are grouped into variable sets.
- Variable sets contain information about how the data should be analyzed and presented when creating a table or chart.
- The structure of a variable set can be modified, and this causes any tables or charts that use the variable set to be modified.
Data Reductions
Variable sets also have a property that we call data reductions. You will not see this term anywhere in the menus. Instead it is a catch-all term that describes the operations that you can perform on a variable set when viewing it as a table.
Please:
- Drag Love on top of Like.
- Click on the column heading which should now say Love + Like, and you should see that a section of the ribbon menu with lots of options for changing the data reduction (Data Manipulation > Rows/Columns) gets highlighted in green.
- Press Rename and change it to say Love/Like.
- Sort by the Love/Like column, from highest to lowest.
- On each table, try to drag Diet Coke on top of Coca-Cola. It will only work for you on one of the tables.
A few things to note:
- We have not merely changed the tables. We have changed the underlying data. Any tables created using these variable sets change in the same way.
- Displayr did not let you merge together Coca-Cola and Diet Coke on the first table because the resulting calculation would make no sense. (If it is not obvious to you why it makes no sense, try and work through what numbers you would expect to see and what they would mean; hint: the percentages add up to 100% within each row.) On the second table the merging did make sense, so Displayr let you do it. Displayr has 13 Variable Set Structures, and, for each, it knows what types of manipulations of the data reduction make sense and how to perform them.
- Variable set structure is something that is imposed on the data. Because of this, the Brand attitude table was structured to show a table of percentages as the most obvious, and best, way to represent the data. You always have the option of changing it to a structure more relevant to your purposes.
- Removing a category from the rows or columns of a table also involves changing the data reduction. The change will apply wherever you use the variable. You can do this in two ways:
- Click on a category on the table and press a delete button.
- Click the variable set in Data Sets (left side of the screen), and press Properties > DATA VALUES > Missing Values (on the right side of the screen).
One versus two-dimensional structures
The original table showed the percentages of people in each of the categories for each of the brands. The underlying variable set in this case has a two-dimensional structure (i.e., a table summarizing the variable set has both rows and columns that represent different aspects of the data). Although two-dimensional structures can be useful, they are not so useful when there is a need to see the relationship between the variable set and another variable set, as the resulting table is large and difficult to interpret. A solution to this is to change the structure to make it one-dimensional. We have already done this when we converted the Nominal – Multi to a Numeric – Multi. However, this also had the effect of changing it from percentages to averages. We can also make it one-dimensional by changing the structure to Binary – Multi:
- Select Brand attitude – numeric in Data Sets, and change its structure in the ribbon to Percentages (Data Manipulation > Structure > Percentages).
- You will see two options. The option on the left does what we want, and will create a Binary – Multi variable set, so press Use this summary. (We could have changed the selections.) Set the name to just Like/Love. You can also change these selections later by clicking on the variable set under data and then clicking Select categories in the object inspector.
- Now merge together Coca-Cola and Diet Coke. It is possible now because, with this variable set structure it makes sense. (If you are not quite sure what I mean, take the time to work through what calculation you would expect to see.)
- Drag gender onto the table at the bottom as Columns. You are now seeing one of the key benefits of having changed the variable set structure (i.e., restructuring the data makes tables better; if you are not convinced, drag Gender onto the By slot for the table at the top).
Splitting Variable Sets apart
Now, click on Like/Love in Data Sets and choose Data Manipulation > Variables > Split. Note that:
- Data Sets no longer lists Like/Love, and now lists each of the brands separately. We have split our variable set that contained 6 variables into 6 variable sets each containing one variable.
- The table at the bottom of the screen has also updated. Its rows now show the data for the first of the new variable sets.
- If we wanted to, we could combine them together using Data Manipulation > Variables > Combine.
Learning more about variable sets
You can find out more about variable sets on our wiki. You can also experiment in Displayr.
