This blog post will take you through the automated tools for filtering and rebasing when analyzing survey data.
We have already covered how to create and apply filters using Displayr’s built-in functions and code. See, for example, 5 Ways to Create a Filter in Displayr, How to Filter Data in Displayr and How to Use Basic R Code for Creating Filters. Below we will now outline the best functions for automating these tasks.
Creating binary filters from selected data
When creating a single filter variable, you can simply go to Insert > Filter > New Filter and choose the appropriate category. However, repeating this step for each category can potentially be time-consuming. Instead, creating many filters quickly is as easy as selecting the relevant variables and going to Insert > Filter > Filters from Selected Data. This will produce a filter for each category in the source question. Note that if you merge any categories via the related table, they will instead flow through to these filters, and any that have been removed will be excluded.
The grouped filters will appear below the source question under Data Sets.
A second use for this function is when you have Binary – Multi (Compact) or ‘Max-Multi’ questions that you wish to convert to binary data. This will in turn produce a single variable for each category. You can then untick the Usable as a filter option in the output if this is not needed.
Creating combo and list box controls and filters
While it generally takes a few steps to connect filters to a control box, there are shortcut options available.
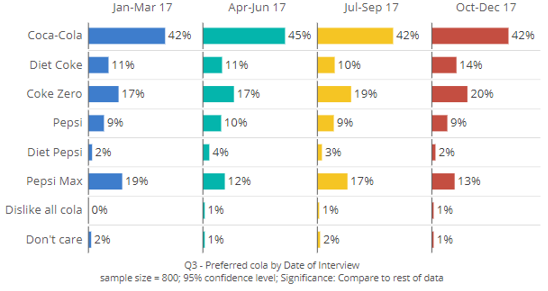
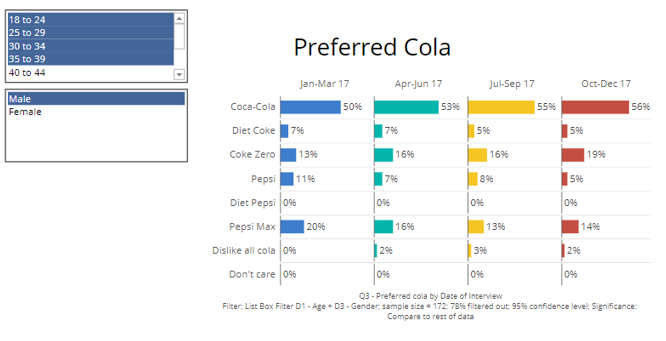
In this example, I have the following grid of bars chart showing preferred cola over time:
To automatically apply a control filter, you should do the following:
- Select the output(s) and go to Insert > Filter > Combo Box (Drop-Down) Filters on an Output or List Box Filters on an Output. We will choose a list box.
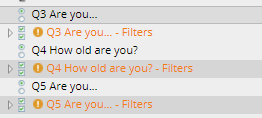
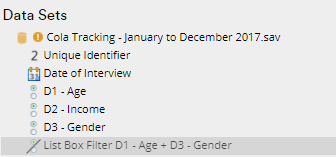
- Next, choose the single-response variables you wish to use for the filter. Here I have chosen ‘D1 – Age’ and ‘D3 – Gender’. Note that for each question selected, a separate control box will be created.
- If you are creating combo boxes, you will need to additionally select Yes to allow the user to select more than one category in each control box.
- A new combined filter variable called ‘List Box Filter D1 – Age + D3 – Gender’ has now appeared under Data Sets:

- 2 list boxes also appear on the page with the filter automatically applied to the chart:

Creating text box controls and filters
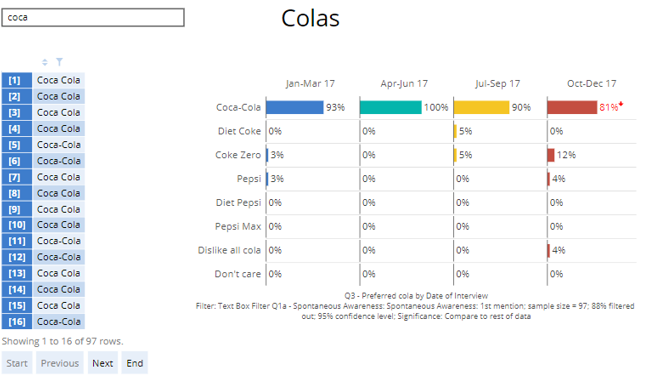
An alternative to a combo or list box is a text box filter. You can use this for filtering lists of verbatims or any other output for that matter. The process is almost the same via Insert > Filter > Text Box Filters on an Output except for 2 steps:
- In step 2 above you will only have the choice to select text variables for creating the filter.
- In step 3 you will be asked if you want the filter to ignore case, that is, it doesn’t matter whether you use capital letters or not.
The result will be a text field that you can type into to filter the other outputs. In the below example, we have based our text filter on an open-ended cola awareness question. When we then type “cola” into the field, it automatically filters the text question and the chart based on those who wrote “cola” in their verbatim response.
Rebasing multiple-response data to the NET
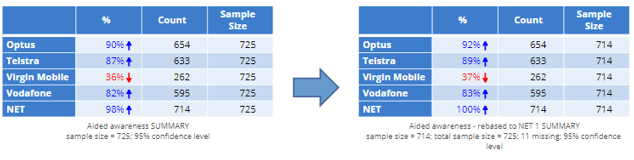
There are often situations when missing value settings in your data set are incorrect for multiple-response questions due to respondents skipping the question. This can lead to the NET not being 100%.
In the below example, there are 11 records out of 725 which have no data so we want to rebase the question out of those who actually answered it. This can be easily rectified via Insert > Utilities > Create New Variables > Rebase Multiple Response Data in Variable(s) to NET. This option will create a new rebased question at the bottom of your Pages section and provide the option of hiding the incorrect version in the prompt.
Rebasing questions based on other questions
Data exports can often have limitations with how missing values can be set when questions are filtered within the survey. This can leave the data file with incorrectly based questions. Alternatively, you may simply want to rebase your data differently on awareness or usage, for example.
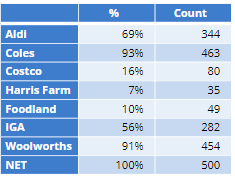
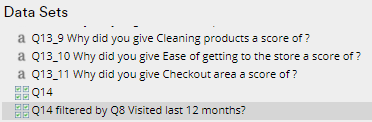
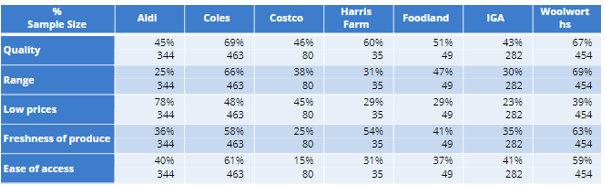
In the following example, we have a multiple-response grid, Q14, where the respondent was asked to identify what supermarket brands correspond to specific attributes.
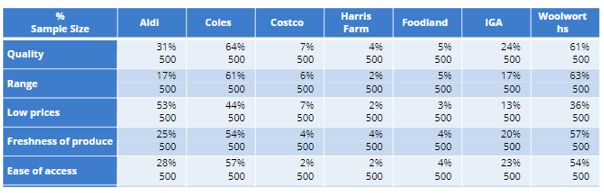
The table is currently based out of total sample but we would like to base it out of Q8, that is, whether they have shopped at these stores in the past 12 months:
The steps to follow are below:
- Go to Insert > Filter > Filter One Question by Another Question
- When prompted, select the question you want to filter then press OK. We will select Q14 here.
- When prompted, select the question to use as a filter then press OK. Here we will select Q8.
- If the question to be used as a filter is tagged with Usable as a filter, you will be asked whether you wish to simply apply this filter (Yes) or create a variable for each category (No).
- If the question to be filtered has multiple variables, you may be asked whether you wish to split each variable by the filter categories (Yes) or simply apply the matching filter (No).
- If you want Displayr to automatically match up the filters based on the source labels, select Yes.
- As our labels match perfectly, Displayr will generate a new version of our question with the correct basing called ‘Q14 filtered by Q8 Visited last 12 months’:

The table looks like this:
- Note that if you select No in step 4 or there are inconsistencies with labels and/or additional items, you will need to manually select the variables that correspond to each filter category via the prompts.
- You can then choose whether to keep or remove the extra items that were not matched.
To avoid these extra steps, you can simply adjust the variable labels under Data Sets to provide consistency. If the difference, however, is only that the filter question also includes a “None of these” option, the easier solution is to copy this question via Home > Duplicate, go to DATA VALUES > Values, and set this option to Exclude from analyses. Now you can use this question instead and the items will match.
Note that, much like with the Filters from Selected Data option, here Displayr will also respect any merged or removed categories when creating the new variables.
Filtering variables
A second use case for Filter One Question by Another Question is for filtering your variables to allow for a 3-dimensional table.
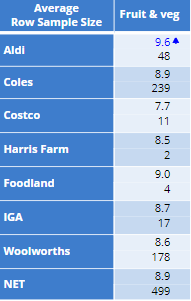
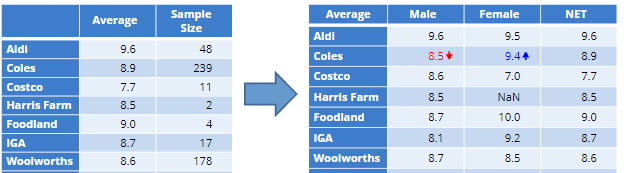
Below is a table of how likely respondents are to recommend buying fruit and vegetables as an average crossed by the last supermarket they visited.
Although these 2 questions are easily crossed, you may still want to cross break the table further. This is where this script comes in handy.
As with the first few previous steps, you simply need to do the following:
- Go to Insert > Filter > Filter One Question by Another Question
- When prompted, select the question you want to filter then press OK. We will select ‘Q12 Fruit & Veg’.
- When prompted, select the question to use as a filter then press OK. Here we will select ‘Q10 Last visited supermarket’.
The result is a simplified table which can now be further filtered by applying a banner question, such as gender:
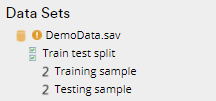
Splitting sample
Displayr also offers you an automated solution for splitting your sample for predictive modeling such as regression.
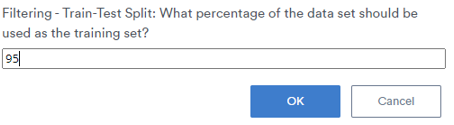
The first option via Insert > Filter > Filters for Train-Test Split randomly creates a training and a testing filter. This defaults to a 70% / 30% split but you can change this in the prompt.
The second option via Insert > Filter > Filters for Train-Validation-Test Split randomly creates a training, validation, and testing filter. This defaults to a 50% / 25% / 25% split but you can likewise change this in the prompt.
Another use for this function is for effectively removing additional records from your data set if you have gone over your survey targets. In this case, you could use the Filters for Train-Test Split option and set the training sample accordingly.
If you wanted to remove 5% then you could use either 95 or 5 for the prompt and choose the appropriate filter:
This results in 2 grouped filters at the top of your data set: