Displayr automatically keeps track of all calculations in a document. It always remembers how everything has been computed. We’ve now added a great new graphical tool, called the dependency graph, which shows how calculations come about.
You can view the dependency graph of an output by right-clicking on it and selecting Dependency Graph from the context menu.
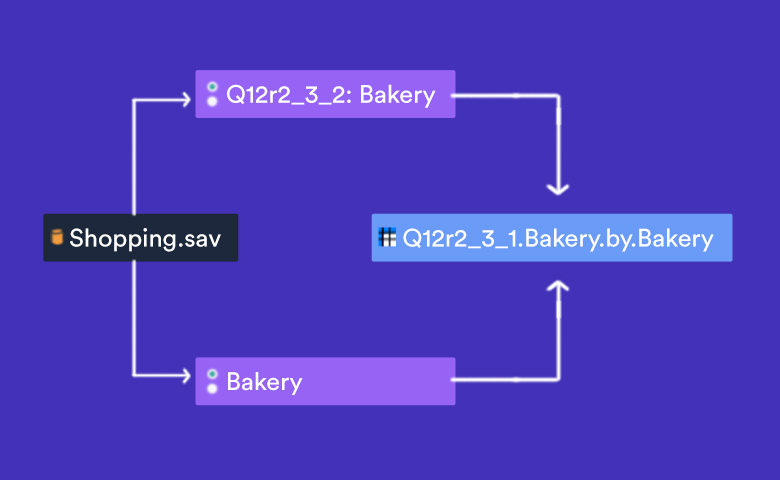
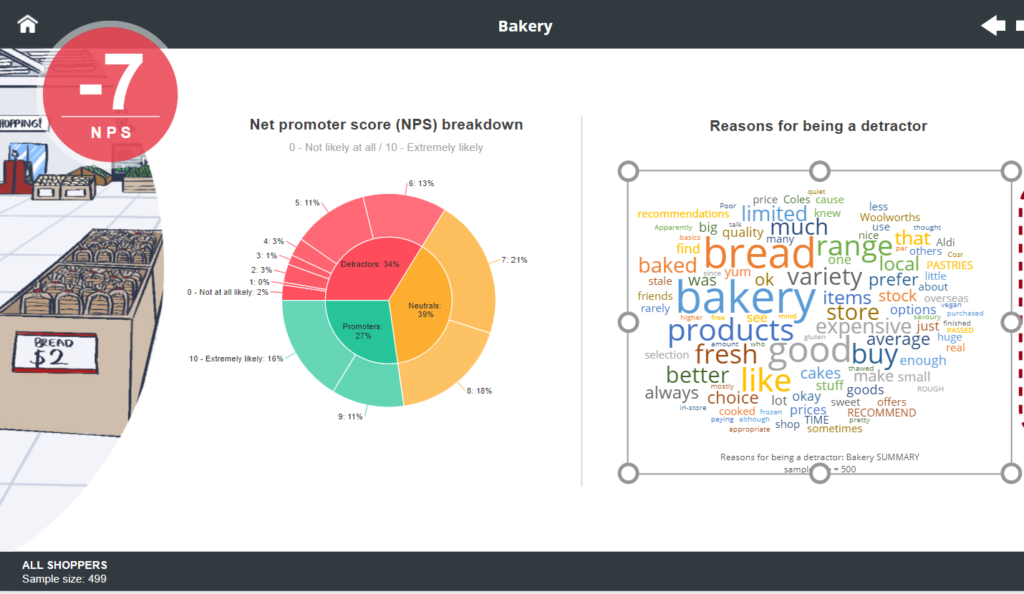
 As an example, the dependency graph above is for the word cloud shown below. We can see from this dependency graph that the word cloud has been created using the variables Reasons for being a detractor: Bakery and Detractors: Bakery.
More information is in our help center article Viewing Dependency Graphs to Understand Calculations and Performance.