The order of attribute levels in choice-based conjoint analyses are determined by their order in the experimental design file. This order is not always best from an interpretation perspective. In particular, it can be useful to reorder attributes so that the first category reflects the base case, and the remaining categories follow in some relevant order.
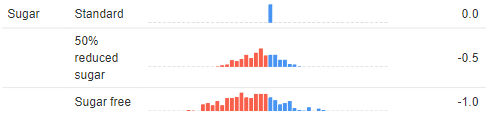
As an example, the levels of an attribute showing preferences for sugar levels in a chocolate study are shown below. A more useful ordering would set the standard sugar level as the first category, making it easy for people to assess the relative appeal of the sugar-free attributes.
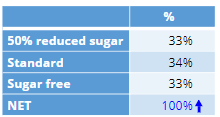
Step 1: Create a table showing the variable
Tables are created by dragging a variable set from the Data Sets tree.
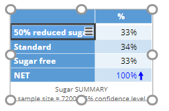
Step 2: Reorder the categories in the table
The categories in a table can be reordered by dragging and dropping. First click on the row heading, which will show as a grey box with three black lines (a “hamburger”). Then, click on the hamburger and drag it to where you want it. Depending on where you release it, the category will be moved or merged with other categories.
Provided that the model is set to update automatically, it will instantly recompute to reflect the new order.
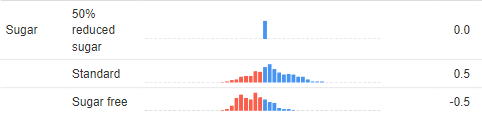
The reordering is mainly done for ease of interpretation. It should not be expected to have a substantial effect on any predictions or the correct interpretation of the results. The results from the reordered sugar category shown at the beginning of this post are below. Note that the difference between the mean utilities (shown in the column of the numbers to the right) remain unchanged. However, this reordered analysis makes it easier to see the key conclusions:
- Most people prefer the standard levels of sugar in chocolate
- “50% reduced sugar” is, on average, halfway between standard and “Sugar free”
- There’s a lot of heterogeneity (variation) in terms of preferences for “Sugar free,” with a clear segment of people with a positive (blue) preference for reduced and sugar-free chocolate