


Manually coding text data into categories is one of the great pains of survey research. By contrast, many automatic text coding tools ease the pain of coding but don’t do as good of a job. As a result, oftentimes people just use word clouds to analyze text instead. However, a recent breakthrough in coding can give you the best of both worlds! Displayr’s semi-automatic text analysis tool gives you the control to categorize text as you wish alongside automatic categorization capabilities. Better yet, as you categorize more text, the tool becomes smarter and can help you identify other relevant phrases and categories in your data.
In this post, I provide a walk-through of how to use Displayr’s semi-automatic text analysis tool. While this example focuses on text that needs to be categorized into overlapping categories (i.e., multiple response coding, to use the market research industry jargon), the same basic approach can be used for creating mutually exclusive categorizations (i.e., single response coding).
The data
The data is from a study of the (mobile) cell phone market. We asked people what they liked about their main cell phone provider. The raw responses are shown in the table below.
Getting started
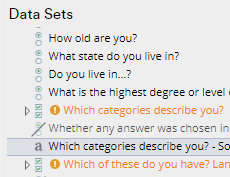 We start by adding a data set, selecting the text variable (it will have an a icon, as shown to the right), and pressing Insert > Text Analysis > Semi-Automatic Categorization > Multiple Overlapping Categories > New.
Adding categories
Categories, known to market researchers as the code frame, are shown on the right side of the screen. By default, Displayr automatically starts with two categories:
1. Missing Data
2. New Category (You can rename New Category by right-clicking and selecting Rename.)
If you do not know what categories to create, you can read through the data to come up with your own categories or press the Suggest button. The first time you do this, you will have a long wait while Displayr builds some models in the background. Though after this initial run-through, it will be much faster!
To add new categories one at a time, right-click and select Add Category. To add categories in bulk, click Import/Export Category Names. The screenshot below shows the six initial categories that I created for this cell phone data set.
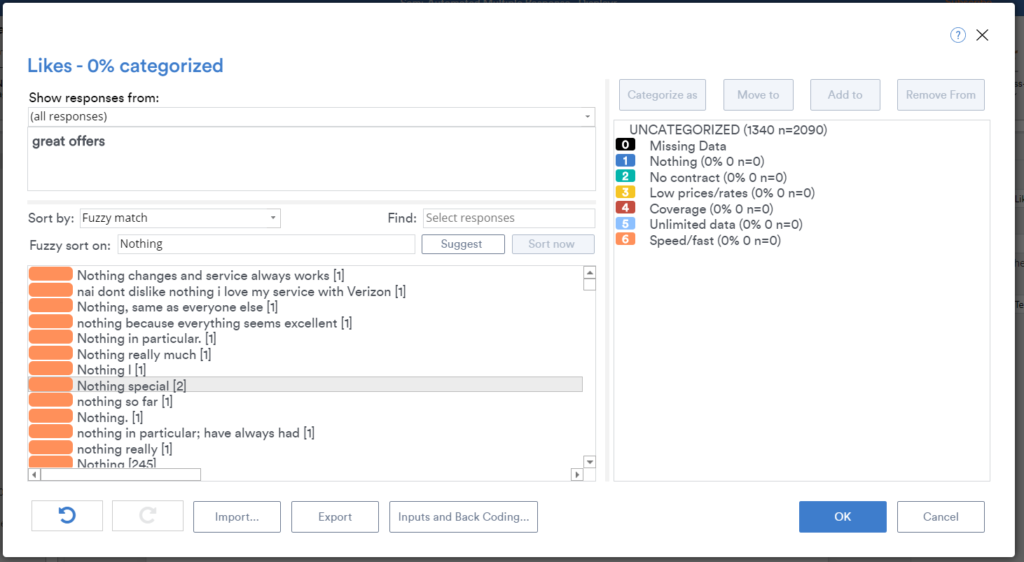
Performing a fuzzy sort
Type the name of the first category that you wish to identify in the Fuzzy sort on box and press Sort now. Displayr will think for a bit and sort the items in the list according to their similarity to the term. You’ll notice in the screenshot above, I’ve done a fuzzy sort on the word Nothing (as in, there is “nothing” that the respondent likes about their phone company). The orange bars show how similar the words are to the search term. In the screenshot above, all the orange bars are the same length, as all the text we see precisely matches the word “nothing”. You can see the orange bars become narrower in the screenshot below as results become less exact.
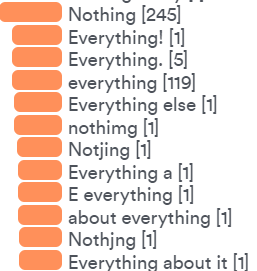
Now, I’m sure your first instinct when you see that Everything is a fairly high result is that the algorithm is very dumb. But, what’s really going on is a bit more subtle than this. Everything and Nothing are both quantities. They are similar constructs. While our human judgment tells us not to group them together, no computer can know for sure how to treat these without some training. This is the entire logic behind semi-automated text analysis! We progressively give the computer more information so that it can refine the models until they are accurate.
Analyze your own text.
Start a free trial of Displayr.
To help teach the algorithms within Displayr the difference between different terms, you simply categorize more text. For example:
- Click on the category you wish to use on the right side of the screen. In this case Nothing.
- Select the text responses you wish to categorize into that category. You can either:
- Use the Shift and Ctrl keys on your keyboard to multi-select from your fuzzy sort.
- Type a word or phrase into the Find box and exact matches to this will be selected.
- Press the Add to button. This tags the responses with the category.
- Repeat this process for the remaining categories.
Predicting similarity
When we use fuzzy sorts, Displayr is using encodings in the background (see At Last, Machine Learning Can Finally Categorize Text Data Accurately!). However, once we have put some data into multiple categories, machine learning models have sufficient data to be trained, which allows Displayr to provide more accurate suggestions.
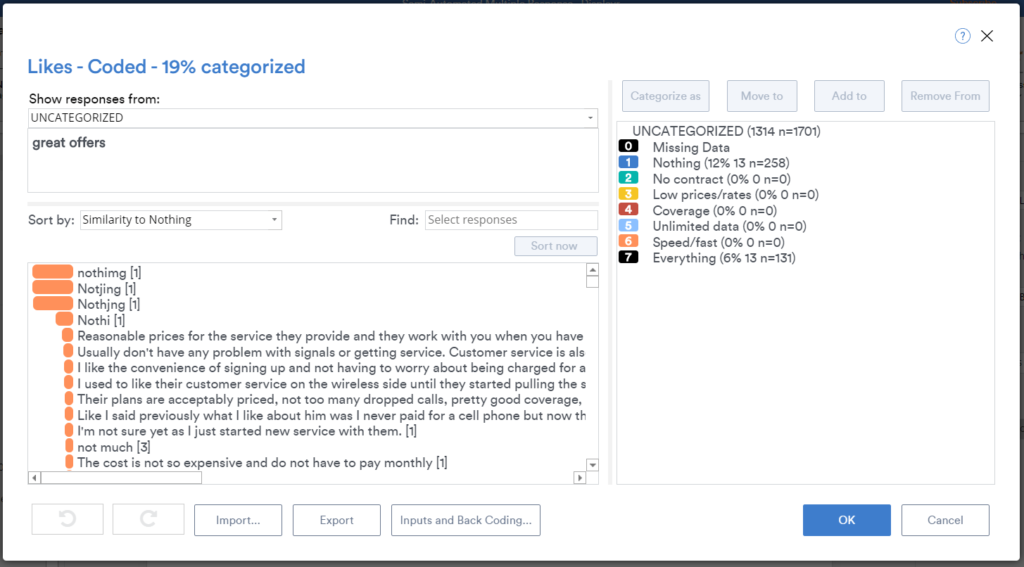
In the screenshot below, I’ve allocated 13 unique responses to the Nothing category and 13 unique responses to the Everything category and then chose Sort by as Similarity to Nothing (i.e., the Nothing category). Looking at the responses, you can see that model’s done a good job:
- It’s identified text responses where people have just failed to spell remotely correctly.
- There is a clear drop-off in the orange bars between responses similar to Nothing and those that clearly don’t belong.
Hunting for missing categories
The most challenging aspect of using semi-automatic coding is ensuring that you have not inadvertently missed a key category. There are three strategies for doing this:
1. Read through, say, 200 responses and check that each has been categorized appropriately
This is the textbook approach to ensure that you have not missed a category.
2. Examine uncategorized data
Change Show responses from (at the top-left of the screenshot) to UNCATEGORIZED.
3. Suggest
This automatically hunts through the dataset to try and find clusters of similar words and proposes these as a new category name, which you can investigate by using the fuzzy sorting.
Refining the categorization
Once you have started coding some data, you may find that you need to change your categories or move text between them. Please see Manually Coding Multiple Response Text Data in Displayr for more information about how to do this.
Automatic updating with new data
Once you have performed a categorization semi-automatically once, you can then entirely re-use it automatically with new data. See Automatic Coding of Unstructured Text Data for more information about this.
To recap
You no longer have to choose between the pain of manual coding and the quality of your results. Both are achievable by using a few key features in Displayr’s semi-automatic categorization tool:
- The Suggest button analyzes your text and recommends additional categories.
- Fuzzy sort on finds exact as well as non-exact matches to your search terms.
- Sort by Similarity to categories analyzes your coded text and tries to find uncoded text that is similar to responses in the category.