
Goodness of Fit in MDS and t-SNE with Shepard Diagrams
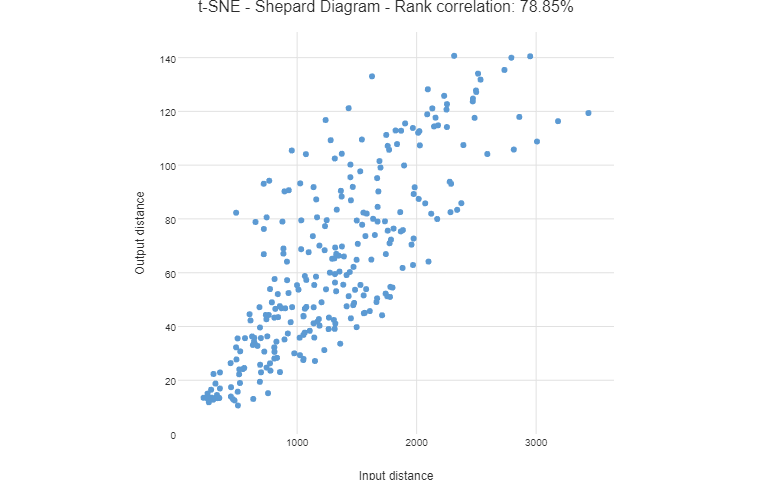
The goodness of fit for data reduction techniques such as MDS and t-SNE can be easily assessed with Shepard diagrams. A Shepard diagram compares how far apart your data points are before and after you transform them (ie: goodness-of-fit) as a scatter plot. Shepard diagrams can be used for data reduction techniques like principal components analysis […]
Learn More about Dimension Reduction in Displayr

Correspondence Analysis Webinar: DIY Market Mapping Using Correspondence Analysis Ebook: DIY Correspondence Analysis How Correspondence Analysis Works (A Simple Explanation) Understanding the Math of Correspondence Analysis How to Interpret Correspondence Analysis Plots Correspondence Analysis Versus Multiple Correspondence Analysis Principal Component Analysis Principal Component Analysis (Wiki example) How to Do Principal Components Analysis in Displayr The […]
What is Multidimensional Scaling (MDS)?
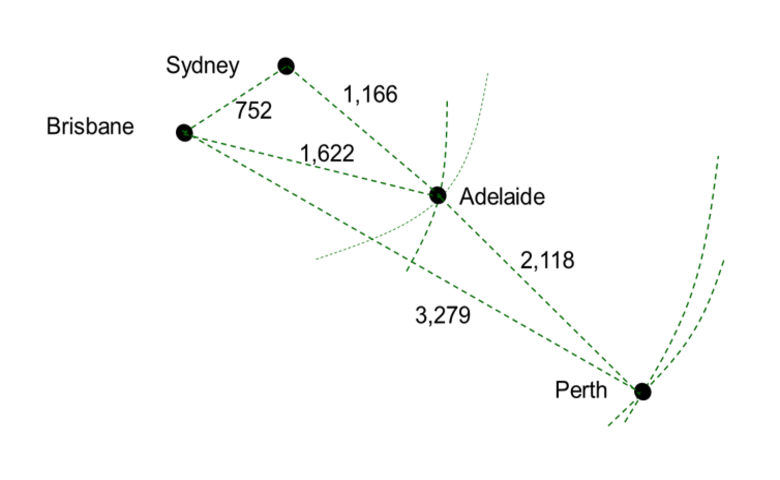
The input to multidimensional scaling is a distance matrix. The output is typically a two-dimensional scatterplot, where each of the objects is represented as a point. Worked example 1 To illustrate the basic mechanics of MDS it is useful to start with a very simple example. The distance matrix below shows the distance, in kilometers, […]
How t-SNE works and Dimensionality Reduction
When setting up a predictive model, the first step should always be to understand the data. Although scanning raw data and calculating basic statistics can lead to some insights, nothing beats a chart. However, fitting multiple dimensions of data into a simple chart is always a challenge (dimensionality reduction). This is where t-SNE (or, t-distributed stochastic neighbor embedding for […]