

The input to multidimensional scaling is a distance matrix. The output is typically a two-dimensional scatterplot, where each of the objects is represented as a point.
Worked example 1
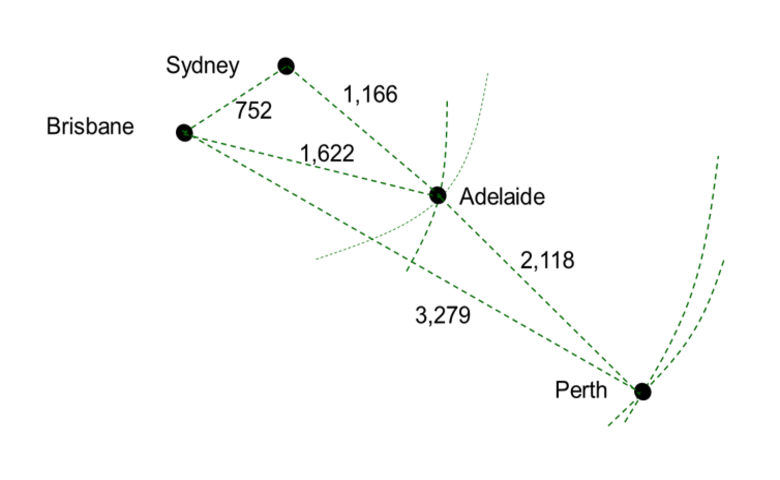
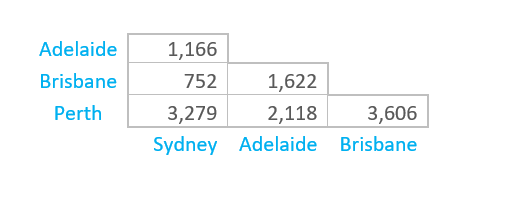
To illustrate the basic mechanics of MDS it is useful to start with a very simple example. The distance matrix below shows the distance, in kilometers, between four Australian cities. From these distances alone, we can reconstruct the map (shown below) which shows the distance between the cities.

Worked example 2
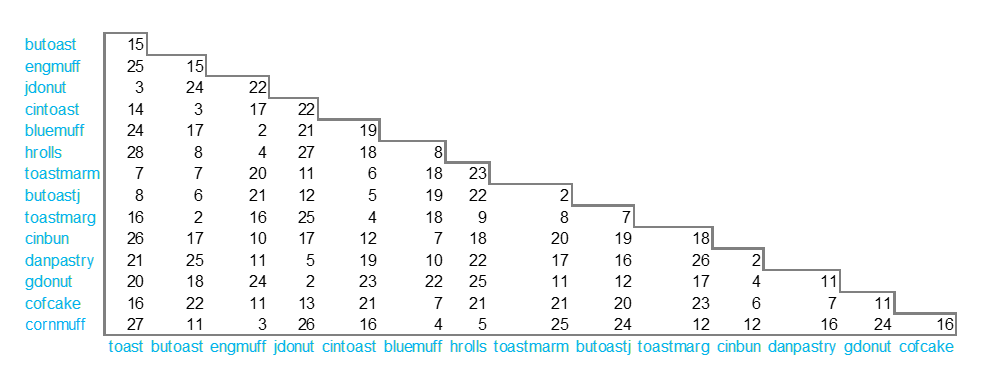
The distance matrix below shows the perceived dissimilarities between 15 breakfast baked goods, where a high number means that the subject rated them as being very dissimilar, and a lower number indicates the pair of baked breakfast goods are highly similar.
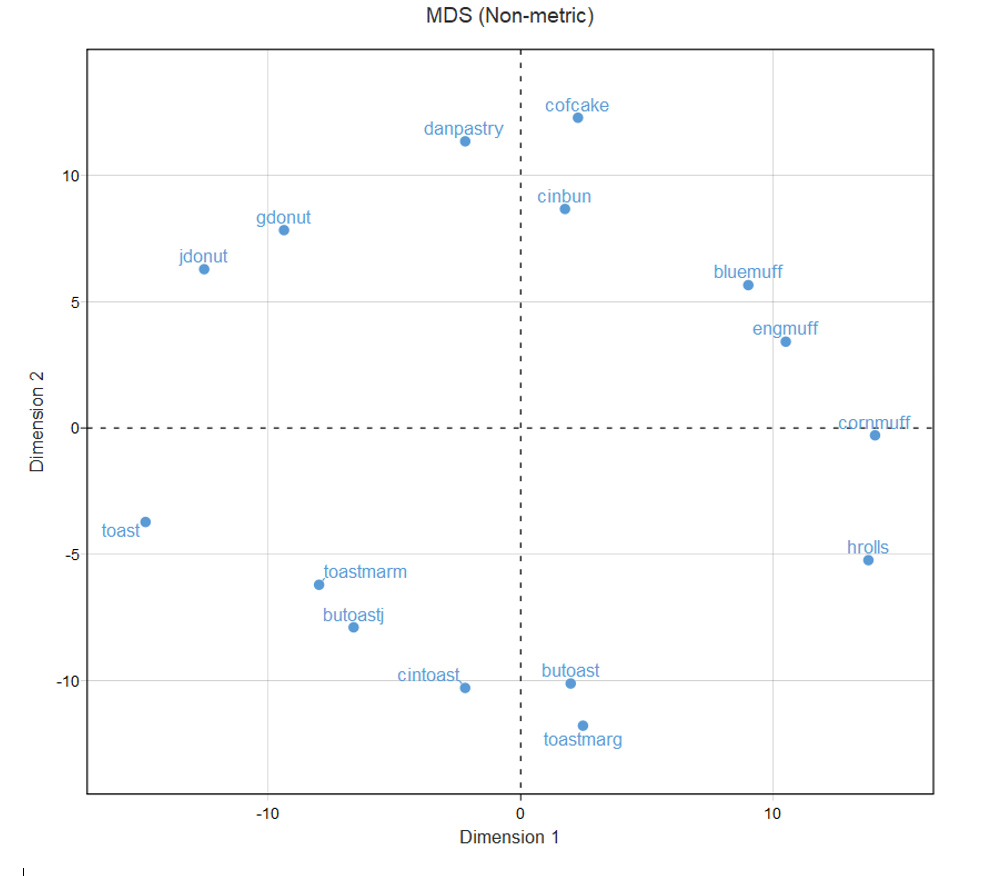
The resulting “map” is show below.
Try Multidimensional Scaling
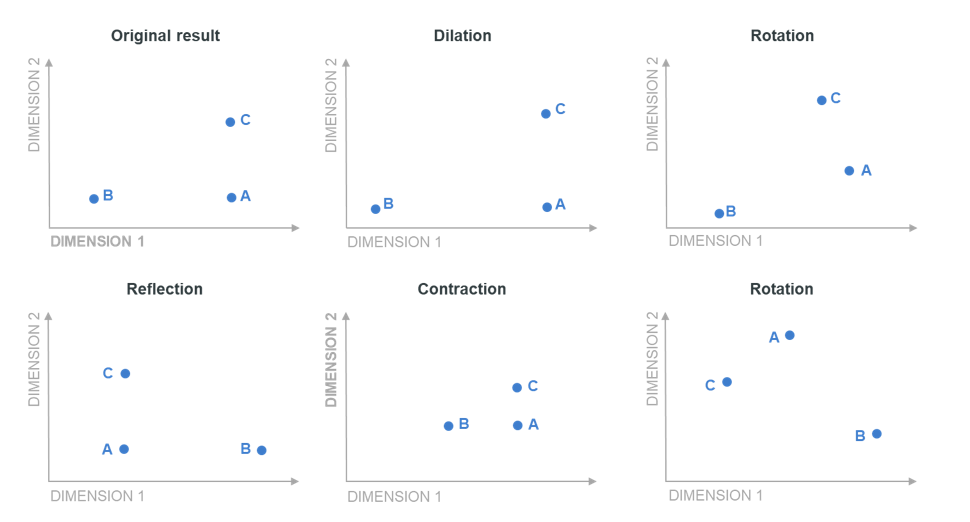
How to read an MDS “map”
When reading an MDS map, we can consider only distances. Unlike a geographic map, there is no concept of up or down, or north and south. The actual orientation that appears on a map (i.e., the up and down) is entirely arbitrary, and there are many other identical possible positions, as shown below.
MDS algorithms
In the simple example at the beginning of this article, the map reproduces the data exactly. In more realistic applications, such as the one involving baked goods, there tend to be contradictions in the data and it is impossible to show all the distances on the map accurately. Looking at the example above, jdonut and toast have a dissimilarity of only 3 in the distance matrix, but this is inconsistent with a lot of the other distances, so on the map these two baked goods are further apart.
Researchers have developed different MDS algorithms which make different decisions about how to reconcile these contradictions. The two most well-known are metrics MDS, which seeks to show the distances so that they are, on average, correct, and non-metric MDS, which focuses only on preserving the relative ordering of the distances in the distance matrix.
Acknowledgments
The figures showing dilation, rotation, etc., are from Lehman, Donald (1989): Market Research and Analysis, 3rd Edition, Irwin.
The breakfast data comes from Green, Paul E. and Vithala R. Rao (1972), Applied Multidimensional Scaling: A Comparison of Approaches and Algorithms. New York: Holt, Rinehart and Winston.
Need to know everything data science terminology? Take a crash course with our “What is” series.
