R-Bloggers.
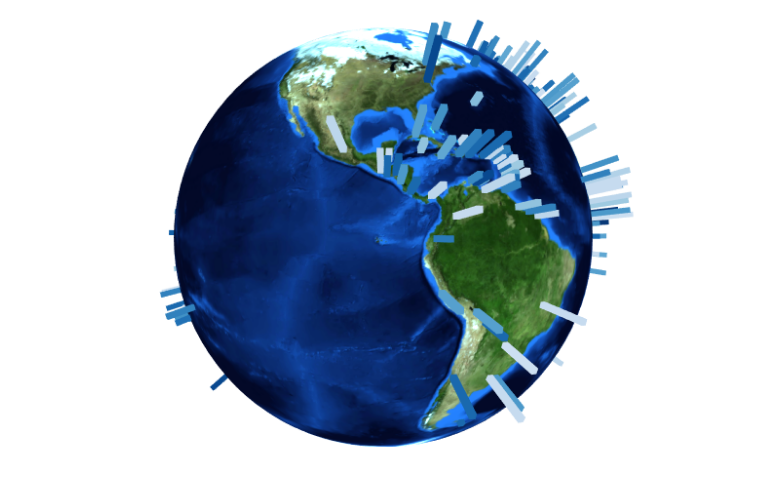
The threejs R package can be used to build an interactive globe visualization and plot geographic data. The globe can be rotated or zoomed in and out.
Continue reading

R tables are not good enough to share with non-R users, both in terms of attractiveness and ease of reading. You can use R to write tables in pure HTML.
Continue reading
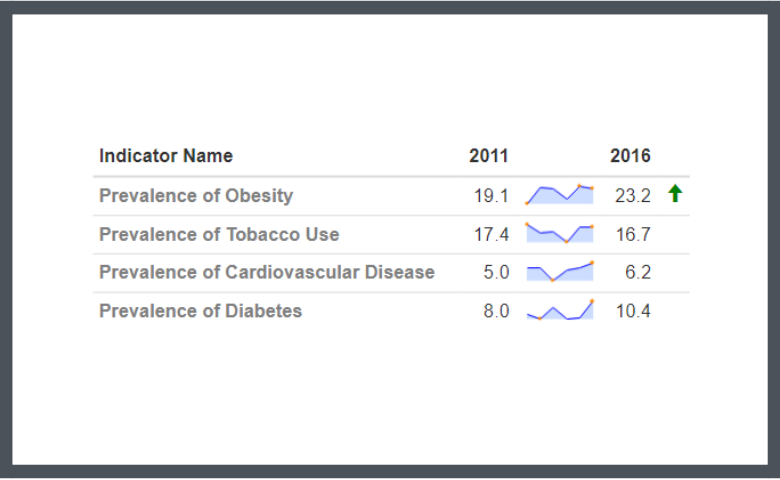
The formattable package allows you to create beautiful tables in R. This post is a handy guide to the syntax of formattable, with worked examples.
Continue reading
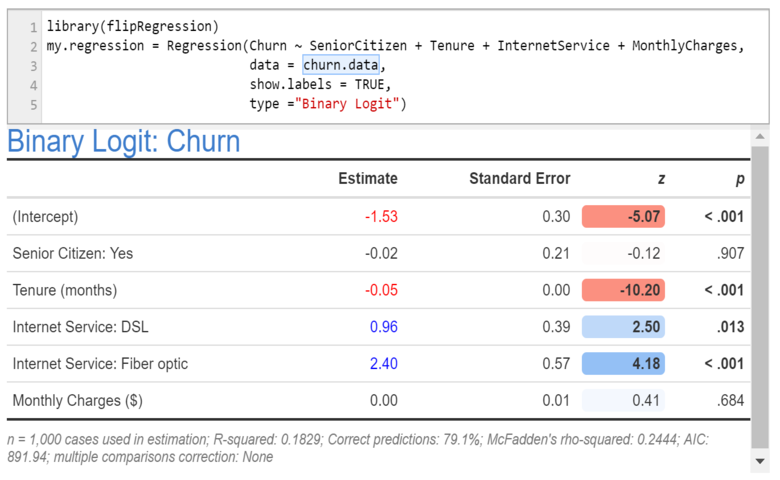
The standard summary outputs from the glm and lm summary methods are a case in point. If you have been using R for as long…
Continue reading
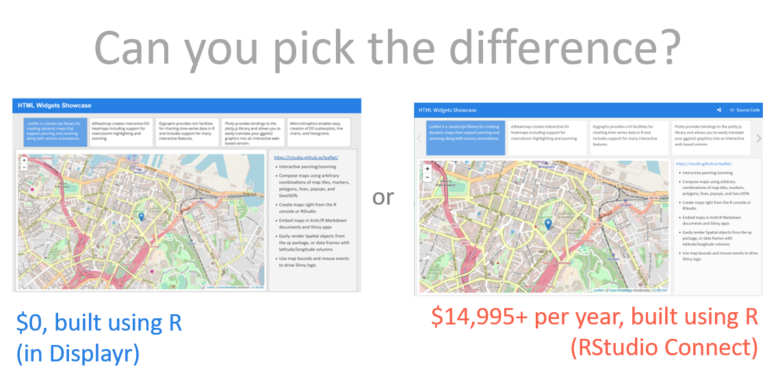
It is now possible to create public dashboards, based on R code, for free. Displayr allows you to create and share interactive charts, maps, and more!
Continue reading