
Trend Lines.

How To Add Trend Lines in R | Step-By-Step Guide
In this article, we demonstrate a number of ways to estimate trend lines in R, and to visualize it using the Plotly package.
Continue reading
How to Add Trend Lines to Visualizations in Displayr
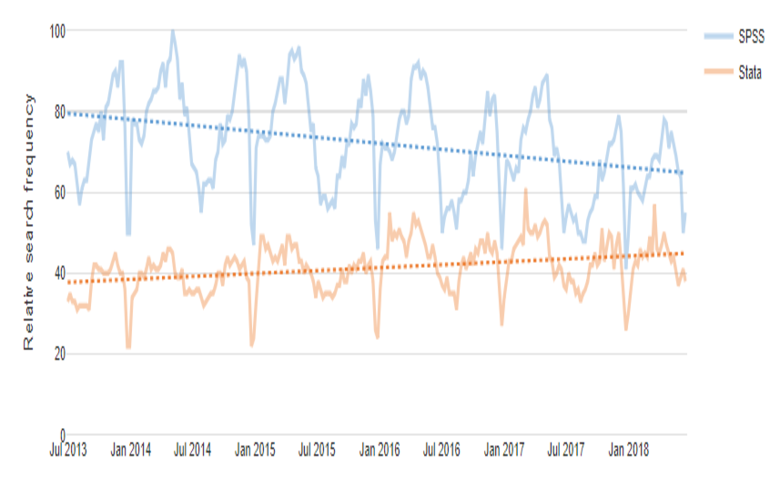
In Displayr, Visualizations support trend lines, which can be linear or non-parametric (cubic spline, Friedman’s super-smoother or LOESS).
Continue reading