A driver analysis is used to highlight the key drivers of performance. Traditionally, it uses quantitative data, where the outcome variable is often satisfaction, likelihood to recommend, or some other measure of interest. The predictors of the outcome are ratings or a multiple-response question indicating the performance of the product(s) being analyzed. However, text data from open-ended questions, tweets, or some other data source are also useful predictors. In this post, I present an example looking at drivers of preference for US phone companies and discuss a couple of traps to avoid.
The case study
The data is from a study of the US cell phone market collected by Qualtrics in July and August of 2019. I’ve used two questions for the analysis. The first is a quantitative question, which measures how likely people are to recommend their main phone brand. The second is qualitative, where people have listed what they like about their brand.
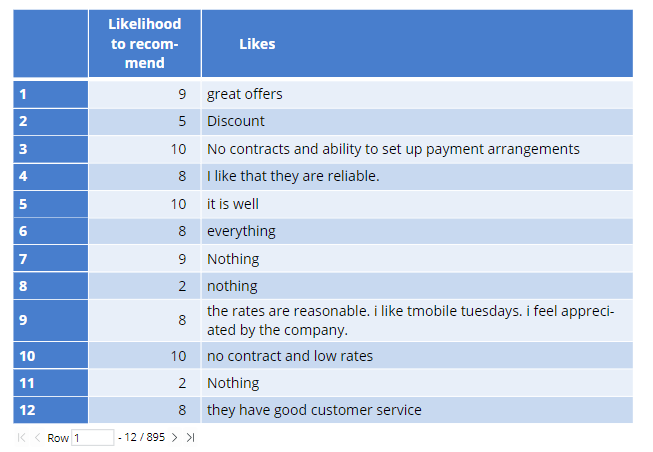
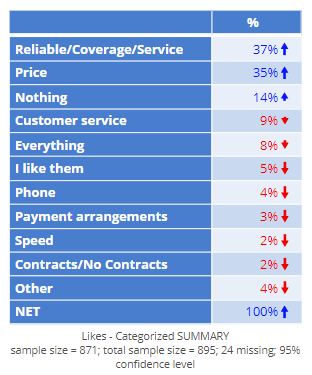
Prior to running the driver analysis, I coded the open-ended data into the categories shown below. You can also use automated techniques for extracting key concepts from the data rather than manually coding it. However, in general this data is a bit noisier, so the resulting driver analysis may be less valid when using automated techniques.
Conducting the driver analysis
As we discuss in our eBook on driver analysis, normally, with driver analysis, it is good practice to use Johnson’s Relative Weights or the near-identical Shapley Regression, as they both rescale the data and deal with multicollinearity. But in this case, there is a smarter approach, which is just to use good old-fashioned linear regression. What makes it smarter?
- One of the key features of coded data is that some categories are bigger than others. In the table earlier in the post, 37% of people are categorized as Reliable/Coverage/Service, and only 2% as Speed. Using Johnson’s Relative Weights or Shapley Regression will ensure that Reliable/Coverage/Service is very important, but that Speed is not. We want the driver analysis to determine importance from the relationship between the predictors and the outcome, not the amount of responses in each category.
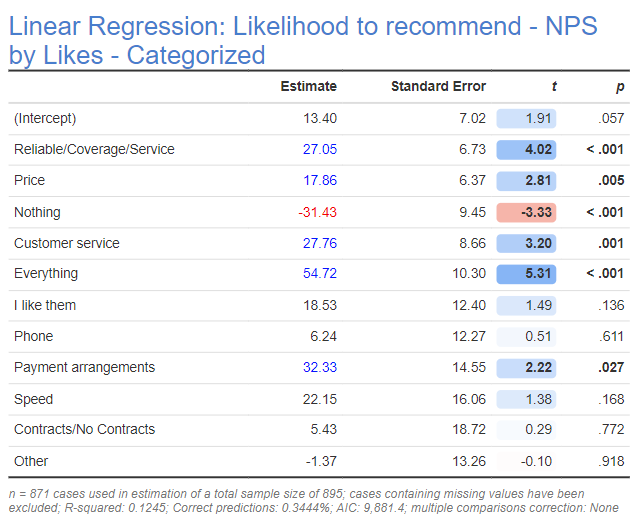
- When we use linear regression we can interpret the estimated coefficients as being differential impacts on NPS. The table below, for example, tells us that all else being equal, if a person likes their phone company due to Price, then their NPS score will be, on average, 18 points higher.
The table below shows the results of a linear regression. At first glance, the regression seems to make sense. People who said they like Nothing have got a much lower NPS, which is as we would expect. But, there is actually a problem here. The goal of driver analysis is to understand how experiences with the company influence attitude towards the company, where NPS is a measurement of that attitude. The categories of Nothing, I like them, and Everything aren’t actually experiences at all. Rather, they are attitudes. So, the regression we have is meaningless, as it currently tells us that how much people like their cell phone carrier predicts their attitude to their cell phone carrier, which is tautological.
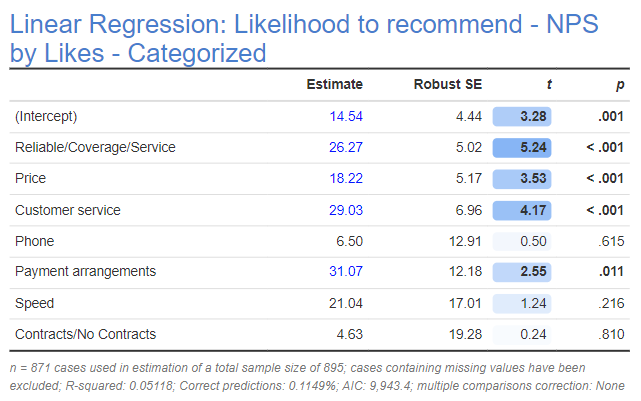
The solution to the tautology is to remove the predictors, which are attitudes, which gives the model below. I’ve also removed Other as it is really a grab-bag of other things and thus uninterpretable.
Checking all the standard things
The next step is to do the standard tests of a regression model (e.g., outliers, multicollinearity, etc.). We discuss these in more detail in our eBook on driver analysis.
Analyze your own text.
Start a free trial of Displayr.
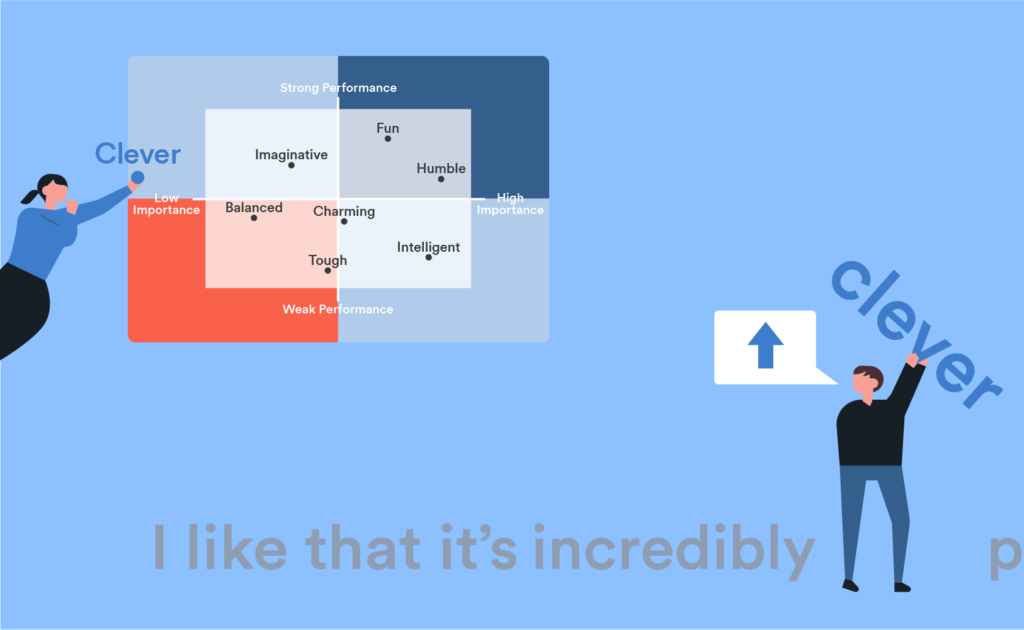
Putting it together as a quad map
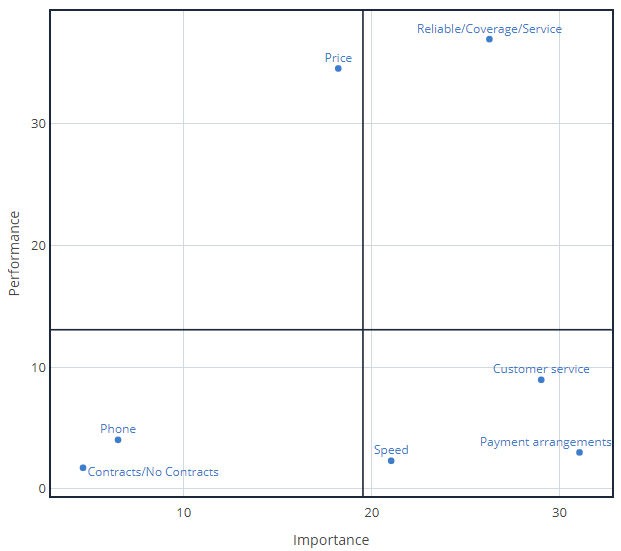
The quad map below plots the importance scores (the Estimate column from above) on the x-axis and the performance (percentage of people to mention the issues) on the y-axis. In this case it delivers some great news, it identifies three opportunities for phone companies to differentiate themselves. The attributes of Speed, Payment arrangements, and Customer service are all in the bottom-right “quadrant”. These are things that people find to be very important, but where the average phone company has low levels of performance, suggesting that if a phone company can persuade more people of its excellence in these areas it will improve its NPS.
Key Traps to Avoid in Text Data Driver Analysis
Performing driver analysis using text data can be a great win. But, I will finish off the post by pointing out a few traps that can trap the unwary. They all relate to inadvertently using inappropriate data:
- Data from people with a known attitude. Sometimes open-ended questions are only asked for people who gave a high (or low) rating. Unfortunately, such data is not suitable for a driver analysis. The whole point of driver analysis is to see how one thing (the text data) predicts another (the overall measure of preference). But, if we have only conducted the analysis among people that like their brand, then we have insufficient variation in their attitude to the brand to work out what causes it. The same problem exists if we have only collected text data from people known to dislike the brand.
- Using data from a Why did you say that? question. A second problem is where people were first asked their attitude, and then asked why did you say that. This is a problem because the actual meaning of this question is contextual. The person who said they really disliked the brand reads the question as why did you dislike the brand? whereas the person that likes the brand reads it as why do you like the brand? This means the text data is not comparable (e.g., if somebody says “price” it may mean the price is too high or too low).
- Using sentiment analysis on a How do you feel style question. In the case study I am using a rating of likelihood to recommend as the outcome variable. An alternative approach is to use an open-ended question and create an outcome variable by sentiment analysis. However, if doing this, some care is required, as it can easily be invalid. For example, let’s say you asked How do you feel about Microsoft? Some people may respond by saying how much they like Microsoft. Other people may interpret this as an opportunity to describe what Microsoft is good at. A driver analysis of such data will be meaningless, as it will show that people who mention specific things (e.g., Microsoft is innovative) will be less likely to give an attitude (e.g., I love Microsoft), as in effect they answered a different question, so we would end up with a driver analysis that tells us that being innovative is bad!