

Data filtering explained
Data filtering is the process of choosing a smaller part of your data set and using that subset for viewing or analysis. Filtering is generally (but not always) temporary – the complete data set is kept, but only part of it is used for the calculation.
Filtering may be used to:
- Look at results for a particular period of time.
- Calculate results for particular groups of interest.
- Exclude erroneous or “bad” observations from an analysis.
- Train and validate statistical models.
Filtering requires you to specify a rule or logic to identify the cases you want to include in your survey analysis. Filtering can also be referred to as “subsetting” data, or a data “drill-down”. In this article, we illustrate a filtered data set and discuss how you might use filtering.
Example of data filtering
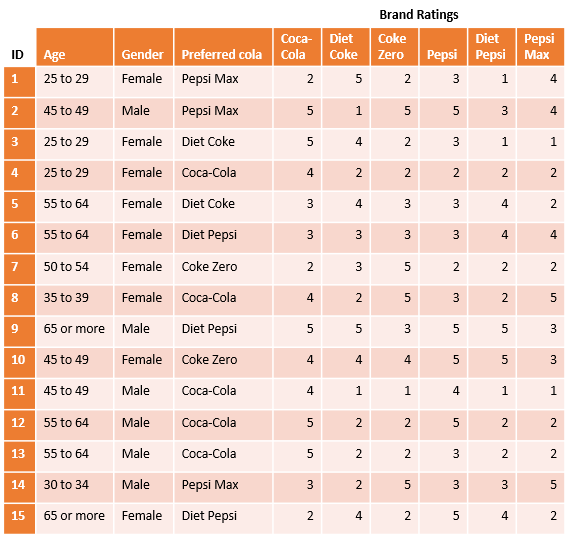
The table below shows some of the rows of a data set from a survey about people’s preferred Cola. The survey data contains demographic information about the respondents as well as each person’s preferred cola and that person’s rating (out of 5) for each of six varieties of cola.
Filtering this data involves:
- Coming up with a rule for the observations needed.
- Selecting the observations that fit the rule.
- Conducting the analysis using only the information contained in those selected observations.
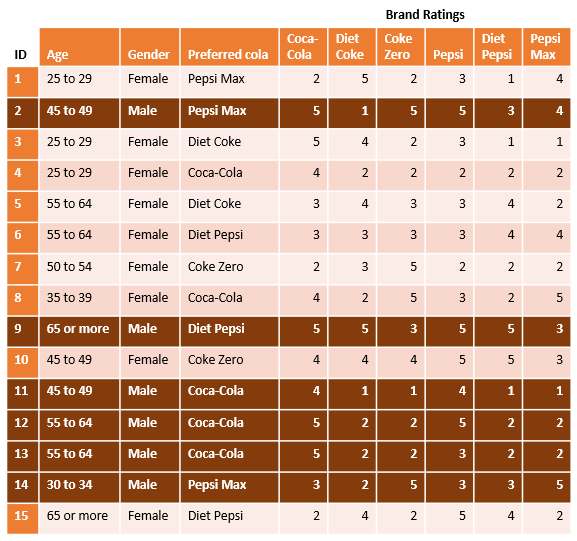
For example, the table below shows the data filtered for Males only. The darker colored rows are kept in the analysis, while the remaining rows are excluded. Results computed for Males are then calculated based on the highlighted rows (ID’s 2, 9, 11, 12, 13, 14). If we want to know the average rating for Coca-Cola among males, we would compute that as (5 + 5 + 4 + 5 + 5 + 3) / 6 = 4.5.
Results for different groups
A basic need for most research is to obtain results for different groups in the data. One may want to ask about the prevalence of a disease within a demographic segment of the overall population, understand sales figures for the past 3 months, or view feedback given by customers who gave your restaurant 1 star on Yelp. In each case, a logical rule defines whether each case in the sample is excluded or included.
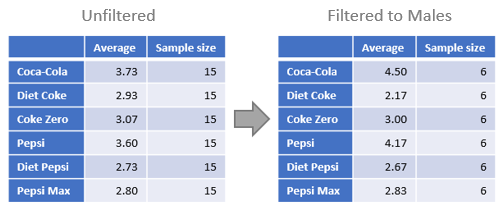
From the example above, we may wish to compute the average rating for each beverage within for the Males in the sample. Such filtering transforms the results like this:
Sometimes filtering is carried out implicitly. For example, in survey research, the columns of a crosstab correspond to a special case of filtering, where filtered results are computed separately for each column, and the results are displayed side-by-side.
Data cleaning
One reason for filtering data is to remove observations that may contain errors or are undesirable for analysis. For example, you may want to remove respondents who did not complete the survey, respondents who raced through the survey and selected answers without paying attention to what they were answering (“speeders”), or cases where data entered manually has been entered with mistakes. In other areas of research, a multivariate technique may only be applicable to cases where there is complete information for all the variables that were measured, and so a filter may be constructed to remove cases where some observations are missing.
Checking results
Filtering can be used to evaluate the performance of statistical algorithms and models. The basic idea is to split up the sample into two or more groups, and then apply the analysis independently to each group and compare the results. This kind of filtering would select cases from the data at random, rather than using a rule that is based on the data. This ensures a valid comparison and is often referred to as training, testing, and validating.
Data filtering by software
| Filtering data in R | Indexing, subset() |
| Filtering data in SPSS | Data > Select Cases |
| Filtering data in Q | Create > Variables > a. Binary – Complicated Filter b. JavaScript Formula c. R Variable d. Logic Select Filter(s) below table/analysis output |
| Filtering data in Displayr | Insert > a. Filter b. JavaScript c. R Select the items you want to filter, and use the Filter(s) menu on the right |