


Data sorting is any process that involves arranging the data into some meaningful order to make it easier to understand, analyze or visualize. When working with research data, sorting is a common method used for visualizing data in a form that makes it easier to comprehend the story the data is telling. Sorting can be done with raw data (across all records) or at an aggregated level (in a table, chart, or some other aggregated or summarized output).
Data is typically sorted based on actual values, counts or percentages, in either ascending or descending order, but can also be sorted based on the variable value labels. Value labels are metadata found in some programs which allow the researcher to store labels for each value option of a categorical question. Most software applications also allow sorting by multiple variables. This type of sorting will be executed in a predetermined variable priority, for example, a data set containing region and country fields can first be sorted by region as the primary sort and then by country. The county sort will be applied within each sorted region.
A Simple Example of Data Sorting
To illustrate a basic sorting operation, consider the table below which has two columns, Country and Population. The Country column is a text field (or label), whereas the Population column contains numeric data. The table on the left shows the original data which is not sorted in any particular order. The table on the right has been sorted by Population in descending order. In other words, the country with the highest population is sorted to the first row, followed by the country with the second-highest population, and so forth.
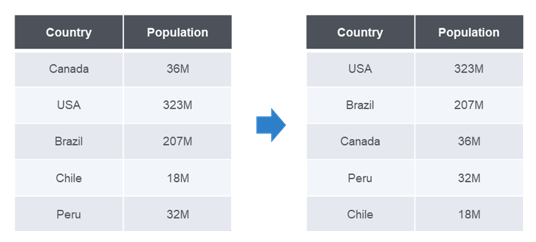
This allows the reader to easily understand the order of the countries, without needing to compare all of the numbers in the table.
Standard Applications for Data Sorting
There are a handful of standard sorting applications when working with any kind of data. One such application is data cleaning which is the process of sorting data to look for abnormalities in a data pattern. For example, monthly sales data can be sorted by month to look for variances in sales volume.
Another common use of sorting is for ranking or prioritizing records. In this situation, data is sorted by some rank, calculated score or other prioritizing value (for example, highest volume accounts or heavy usage customers).
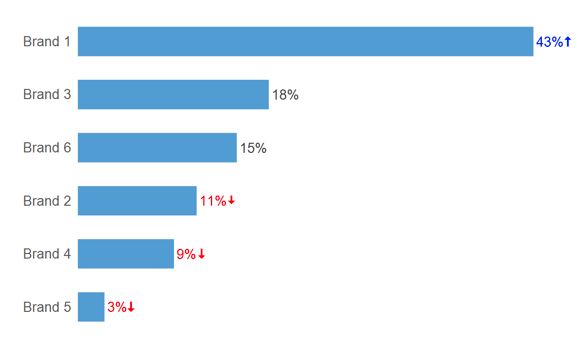
Properly sorting visualizations (tables, charts, etc.) is also extremely important to allow for proper data interpretation. For example, in market research, it is common to sort the results of a single response question by column percentage, i.e. most answered to least answered in descending order as illustrated in the following brand preference question.
However, it wouldn’t make much sense to sort scale questions in the same manner. In these cases, it is better to sort based on the question scale as this makes the data interpretation task much easier.
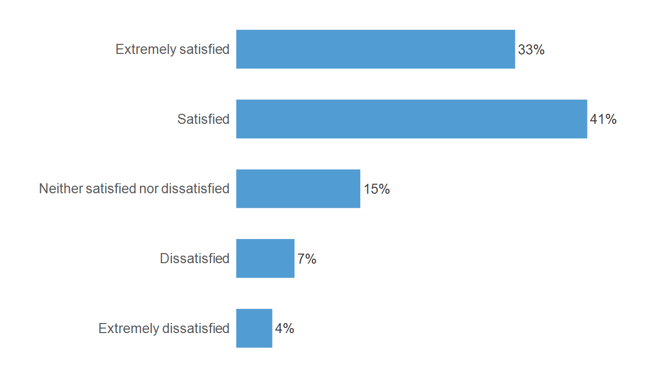
Incorrect sorting can often lead to misinterpretation. It is advisable to always ensure the most logical sorts are applied to all visualizations.
Technical Issues with Data Sorting
Whilst applying sorting functions is a simple concept to grasp, there are a few technical issues to be aware of. One such issue is the arbitrary sorting of non-unique data. As an example, suppose again that you have a data set with region and country fields and multiple records per region. If a sort by region is applied, what would be the default secondary sort? In other words, how will the data within each region be sorted?
This depends on the application. Excel, for example, will retain the original sort as the default sort order after the primary sort is executed. SQL databases do not have a default sort order. Rather this is dependent on other factors such as the database management system (dbms) being used, indexes and other factors. Other applications may apply additional default sorting based on the order of the columns.
Another potential issue is sorting numeric data when stored in a text field. In this case numbers will be sorted in alphanumeric order rather than numeric. For example, consider the following set of numeric values: (12, 4, 1, 31,18, 101). When sorted numerically, they would be returned in numerically sorted ascending order: (1, 4, 12, 18, 31, 101). However, if these values are stored in a text field and sorted in ascending order, the following sort would be returned: (1, 101, 12, 18, 31, 4). This is also a problem when storing date values in text fields.
Data Sorting Software
Most analysis and statistical software packages provide a wide range of sorting functions at virtually every phase of data processing. Read Displayr’s guide to data cleaning tools for more information.
| Application | Available Sorting Methods |
| Q | Apply custom sorting to table outputs, raw data or by using QScript to automate sorting functions. |
| R | Apply sorting functions to various objects with different data structures (vectors, data frames, matrices, etc.) |
| Displayr | Sort table outputs and apply custom sorting to R functions |
| SPSS | Sort table outputs or use syntax to apply sorting to objects |
| SQL | Utilizes the ORDER BY clause to sort a recordset when executing SQL statements |
To begin sorting out your data quickly using Displayr, get started below.
Sign up for free