


TL;DR
The Chi-Square Test of Homogeneity is a statistical test that checks if different groups (columns or rows in a table) have the same underlying characteristics. It sees if the differences we observe are just random chance (sampling error). For example, it can tell us if people living alone and those living with others have the same diet habits. A small p-value would suggest their habits are likely different.
What is the Chi-Square Test of Homogeneity?
The chi-square test of homogeneity tests to see whether different columns (or rows) of data in a table come from the same population or not (i.e., whether the differences are consistent with being explained by sampling error alone). For example, in a table showing political party preference in the rows and states in the columns, the test has the null hypothesis that each state has the same party preferences.
Example of a chi-square test of homogeneity
Consider the table below. It shows that people that people who live with others are marginally more likely to be on a diet but are much less likely to watch what they eat and drink and are much more likely to eat and drink whatever they feel like. However, only 32 in the table are classified as living alone, so it is likely that these results reflect a relatively high degree of sampling error.
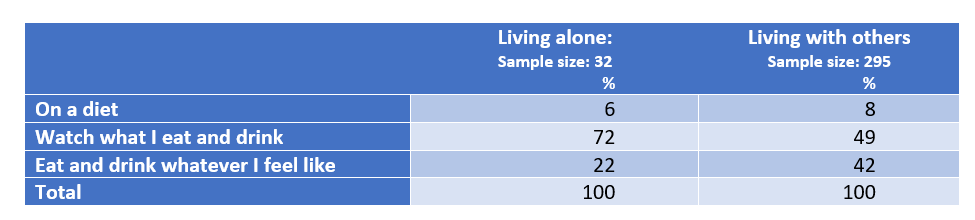
A chi-square test of homogeneity tests whether differences in a table like this are consistent with sampling error. With this data, the p-value is 0.052. As this is greater than 0.05, by convention the conclusion is that the difference is due to sampling error, although the closeness of 0.05 to 0.052 makes this very much a “line ball” conclusion.
How the test is calculated
The table below shows the counts, which is the number of people in each combination of living status and diet practice, along with totals.
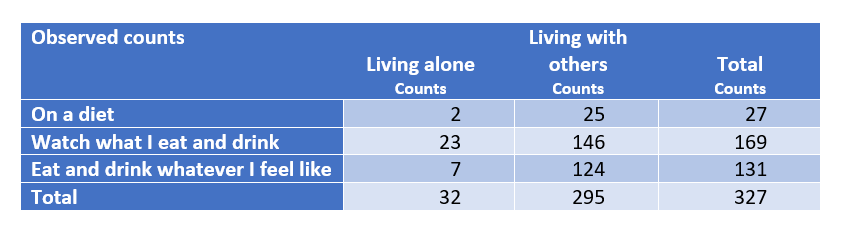
The table above shows that across both groups of people (i.e., those living alone and those living with others), we have observed that 27/327 = 8.3% of people are living alone. If we assume that these two groups of people are the same in terms of their diet practices, we would then expect that in each group 8.3% of people will be on a diet. That is, among the 32 people that live alone, we would expect 8.3% of them, 2.6 people on average, to be on a diet, and 24.4 of the people living with others to be on a diet. Performing the same calculations for the remaining rows of the table, we get the following table of expected counts below.
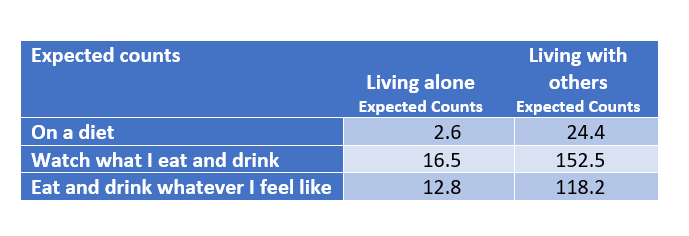
The extent to which the observed counts differ from expected counts reflects sampling error. A chi-square statistic can be calculated which summarizes the overall extent of the sampling error. We start by calculating the cell chi-square value. Where O is the observed value in a cell, E is the expected value, the formula is (O – E)²/E. For the first cell, we get (2 – 2.6)²/2.6 = 0.14. If we repeat the same calculation for the cells excluding the totals and add them up, this give a value of 5.8. This is the test statistic.
To compute a p-value, we need to know the degrees of freedom. This is given by (R – 1) * (C – 1), where R is the number of rows, excluding totals, and C is the number of columns, excluding totals. In this example the degrees of freedom are then (3 – 1) * (2 – 1) = 2. As this is a chi-square test, we can look up the test statistic and the degrees of freedom for the chi-square distribution, and get a p-value of 0.055. Earlier in the article it was stated that the p-values was 0.052 rather than 0.055; the difference is due to rounding errors in the calculation.
Number of rows and columns
In this example the table evaluated had two columns and three rows, excluding totals. The same calculation can be applied to larger tables.
The difference between the chi-square tests of independence and of homogeneity
The actual calculation for the chi-square test of homogeneity is identical to that of the chi-square test of independence; the data input, a contingency table, is also the same. Why then are they different tests? The chi-square test of independence assumes that sampling error plays a role in both which column categories were selected in the data and which row categories were selected.
The test of homogeneity, by contrast, is derived from the assumption that the sample sizes for columns (or equivalently only the rows) has been pre-specified. To put it a different way, if the sample size of either the rows, or the columns, of the table are fixed, the theoretical assumptions of the chi-square test of independence are violated and the test of homogeneity should be implied instead – but you get the same conclusion regardless.
Want to see Displayr’s statistical testing work on your data? Get started for free today.
