


TL;DR: What is the Chi-Square Test of Independence?
The chi-square test of independence tests to see whether there is a relationship between two categorical variables. It is a statistical test to see if knowledge of the value of observation on one categorical variable can be used to predict the likely values of the other variable.
Example of a chi-square test of independence
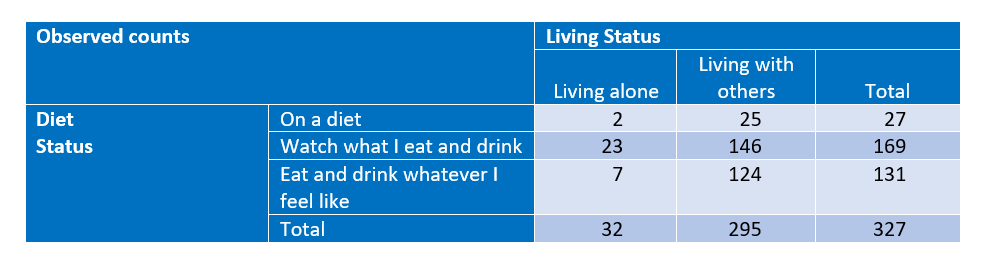
The table below shows a crosstab of two categorical variables. One variable measures diet status and the other, living status. Each cell shows the observed counts. Foxr example, two people live alone and are on a diet, 25 people live with others and are on a diet.
The table below expresses the same data as column percentages. We can see from this data that people who are living alone seem to be more likely to watch what they eat and drink than do people that live with others (72% versus 49%), less likely to eat and drink what they feel like and are less likely to be on a diet. There are two explanations for these differences: there is a causal link between living status and diet status, or the differences are due to sampling error.
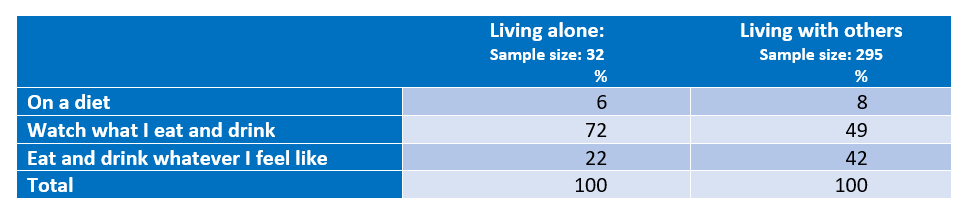
A chi-square test of independence tests the question about whether differences in a table like this are consistent with being caused only by sampling error. With this data, the p-value is 0.052. As this is greater than 0.05, by convention the conclusion is that the difference is due to sampling error, although the closeness of 0.05 to 0.052 makes this very much a “line ball” conclusion.
How the test is calculated
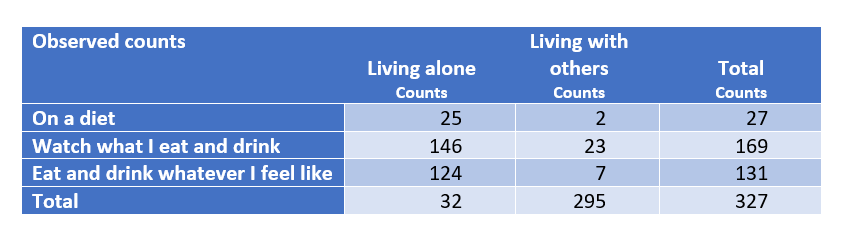
The table below shows the counts, which is the number of people in each combination of living status and diet practice, along with totals.
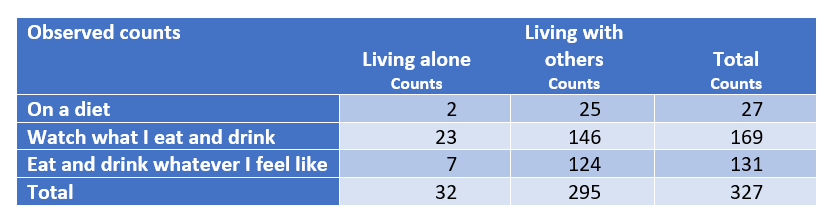
The table above shows that across both groups of people (i.e., those living alone and those living with others), we have observed that 27/327 = 8.3% of people are living alone. If we assume that these two groups of people are the same in terms of their diet practices, we would then expect that in each group 8.3% of people will be on a diet. That is, among the 32 people that live alone, we would expect 8.3% of them, 2.6 people on average, to be on a diet, and 24.4 of the people living with others to be on a diet. Performing the same calculations for the remaining rows of the table, we get the following table of expected counts below.
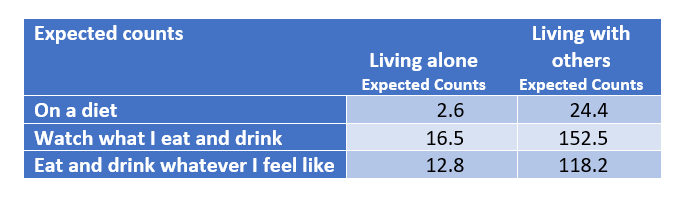
The extent to which the observed counts differ from expected counts reflects sampling error. A chi-square statistic can be calculated which summarizes the overall extent of the sampling error. We start by calculating the cell chi-square value. Where O is the observed value in a cell, E is the expected value, the formula is (O – E)²/E. For the first cell, we get (2 – 2.6)²/2.6 = 0.14. If we repeat the same calculation for the cells excluding the totals and add them up, this gives a value of 5.8. This is the test statistic.
To compute a p-value, we need to know the degrees of freedom. This is given by (R – 1) * (C – 1), where R is the number of rows, excluding totals, and C is the number of columns, excluding totals. In this example, the degrees of freedom are then (3 – 1) * (2 – 1) = 2. As this is a chi-square test, we can look up the test statistic and the degrees of freedom for the chi-square distribution, and get a p-value of 0.055. Earlier in the article, it was stated that the p-values was 0.052 rather than 0.055; the difference is due to rounding errors in the calculation.
Number of rows and column
In this example the table evaluated had two columns and three rows, excluding totals. The same calculation can be applied to larger tables.
Wondering about the chi-square test of independence vs homogeneity? The calculation is identical — the difference is sampling design: the test of independence applies when you drew one sample and measured two variables, while the test of homogeneity applies when the group sizes were fixed by design. See our explanation of the chi-square test of homogeneity for a side-by-side comparison.
Chi-square test of independence or homogeneity?
Wondering about the chi-square test of independence vs homogeneity? The calculation is identical – the difference is sampling design: the test of independence applies when you drew one sample and measured two variables, while the test of homogeneity applies when the group sizes were fixed by design. See our explanation of the chi-square test of homogeneity for a side-by-side comparison.
Need more help with terminology? Check out our other handy What Is guides!