


What is Customer Satisfaction Score?
The Customer Satisfaction Score (CSAT) is a straightforward measure of customer satisfaction. CSAT is calculated by asking customers, “How satisfied were you with your experience today?”
Responses are most commonly collected on a scale of 1-3, 1-5, or 1-10. CSAT can help you identify key areas where your customers are less than satisfied, and this can drive improvements in your business. Using CSAT well can increase long-term customer retention and keep your customers happy.
How To Measure CSAT
CSAT is measured using surveys, in which you ask your respondents to rate their satisfaction with your product, service, brand, or a specific attribute of your product. These surveys can be one question long, or can involve a series of rating scales and open-ended questions. Best practice is to keep your surveys as short as possible while still collecting the necessary data.
It’s important to understand what CSAT surveys can and cannot measure. Otherwise, you risk misunderstanding your results. By nature, the CSAT question asks about immediate satisfaction. As a result, responses typically indicate a customer’s sentiment towards their most recent interaction with your brand. This can be an advantage – measuring CSAT at different touchpoints can inform you about satisfaction with different parts of your product or service. However, it is generally considered inappropriate to use CSAT to infer broader attitudes towards your brand.
Calculating CSAT
There are several different methods of calculating your CSAT score. Three of the most common ways are;
- Top 2 Box Score: Using the percentage of respondents who selected either the top box or the second box. In a 1-5 CSAT survey, this would be everyone who selected 4 or 5. This can also be adapted to be a Top 3 Box or Top 4 Box score, depending on the use case.
- Average: Simply add up each individual CSAT score and divide by the sum of the maximum possible scores. You can then multiply this by 100 to express the average CSAT score as a percentage.
- Median: Identify the value that falls in the exact middle of your sample to find the median. If there is an even number of cases, the middle will fall between two scores, so simply take the mean.
It doesn’t really matter which method you choose, as long as you are consistent in your calculations. You’ll also see CSAT displayed as a percentage or a score out of 10. Again, how you display this data doesn’t matter too much in the scheme of things, but consistency is vital.
CSAT works best as a comparative measure. A CSAT score of 8 doesn’t mean very much, but the same CSAT score of 8 means a lot if you know that last quarter your score was 6. As a result, it’s important to track your CSAT score over time and across different areas of your company. In order to make this a meaningful comparison, it’s crucial that the rating scales, the wording of the questions, and the method of delivery are all kept the same.
Benchmarking Your Customer Satisfaction Score
According to Salesforce, the average CSAT score across all industries is 78%. However, there is a great deal of variation across different sectors, so determining whether your CSAT score is ‘good’ or ‘bad’ will require some investigation into your industry benchmark data.
Customer Satisfaction Survey Analysis: Analyzing and Visualizing CSAT
Once you have all your CSAT data, it’s time to analyze it and extract key insights. It’s a good idea to collect CSAT data for not only overall satisfaction, but also for more granular aspects of your product or service. You can then use relative importance analysis to determine which attributes are most influential for overall customer satisfaction.
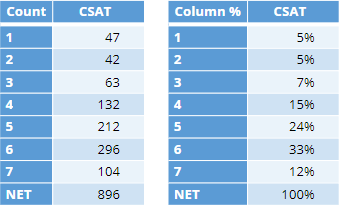
It is also worthwhile to look at the way the frequencies for each scale point. For example, in the table below, you can see that the majority of respondents were either a 5 or 6 out of 7.
When it comes to creating CSAT dashboards, you want to be able to visualize your current CSAT, your CSAT trends over time, and any other notable data that you have collected (such as benchmark data). These dashboards allow you, your clients, and your colleagues to see at a glance the most important data about your customer satisfaction.
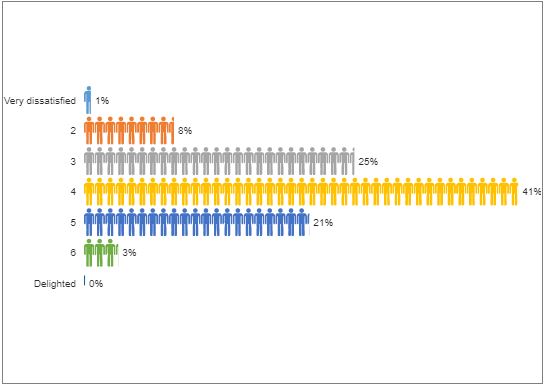
A pictograph bar chart is one of the most effective ways to show the distribution of customer satisfaction responses. By going beyond just an overall score, you can gain clearer insights into how most of your customers feel about your product/service. In the graph below, for example, we can see that most responses are clustered around the mean. This means that incremental improvements to your offering should result in an improvement to the CSAT score.
Other useful visualizations for customer satisfaction score data include;
- Time series line chart: for data from multiple surveys collected over a period of time.
- Geographic map: to highlight how CSAT numbers differ across different regions.
- Stacked bar chart: to illustrate how CSAT score compares with benchmark data
Find out more about visualizing customer satisfaction data here.
Customer Satisfaction Analysis Tools
Customer satisfaction scoring is all about helping you to understand your customers and what drives their loyalty. Displayr is the only tool for measuring, analyzing, and visualizing your customer satisfaction yourself – helping you discover insights that drive real change. Here are a couple of reasons why Displayr stands out for customer satisfaction analysis:
- Advanced Analytics: Ready to use Relative Importance Analysis or Linear Regression to analyze your customer satisfaction? Want to be able to use statistical modeling and machine learning to uncover the secrets to improving your Customer Satisfaction Score? Displayr has you covered.
- Ease of use: Displayr can be used by everyone from the most advanced of researchers to non-technical people.
- Beauty and functionality: Need to present your CSAT findings in an impressive way? You can create beautiful and interactive dashboards. Change filters with one click. Sort your CSAT by departments. Include logos, brand images, and customize it so that it looks exactly the way you want it.
- Recoding made simple: Displayr can automatically recode your data to make it easy to use in a wide range of statistical analyses. Say goodbye to time-consuming manual recoding.
- Statistical testing: Want to know if changes in your CSAT are actually statistically significant? Displayr has in-built stats testing to help you turn data into insights faster.
- Value: Using multiple tools to analyze and present your data? Using add-on dashboarding solutions? By combining all the things you need to do, Displayr will save you from spending. Best of all, you can try Displayr for free!
More on Customer Satisfaction Score
- Introduction to CSAT
- CSAT vs NPS
- Using Customer Satisfaction to Improve Your Business
- CSAT: General, Product, Attribute
- Dos and Don’ts for CSAT Surveys
- What Else to Ask in a Customer Satisfaction Survey
- How to Identify Drivers of Customer Satisfaction + Free Template
- Analyzing Customer Satisfaction Scores
