





Correspondence Analysis Software for Survey Data
Displayr is the easiest and most intuitive correspondence analysis tool, specifically designed for survey research to uncover and communicate data insights effectively. As correspondence analysis software, it handles multiple correspondence analysis and large category tables without coding, and AI can help you interpret and write up the map — with every insight traceable back to the underlying data.
Trusted by 2,900+ research teams worldwide
Correspondence analysis toolbuilt for researchers
All the standard techniques
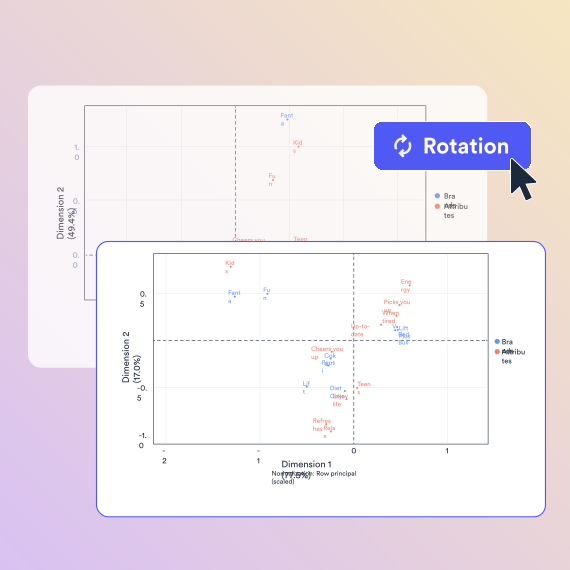
In addition to doing the standard correspondence analysis, we support all the key variants, including multiple correspondence analysis, correspondence analysis of square tables, and trends. You can further customize these using rotation, normalizations, and supplementary data points.
State-of-the-art
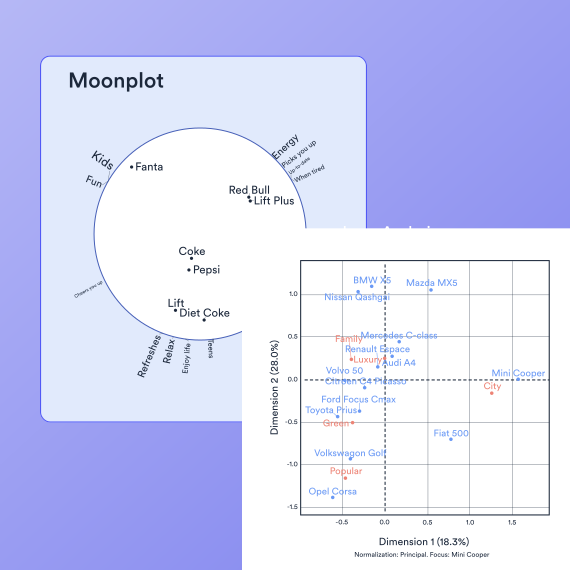
Displayr does three things that aren’t in any other tools. It offers an automated rotation feature, that allows you to focus the analysis on a key feature (e.g., a key brand), ensuring that the analysis is most relevant to your problem. It has the easiest to interpret visualization (the moonplot). Last, but not least, it automatically places the labels so that they don’t overlap (even if you use logos instead of labels).
Designed for market research
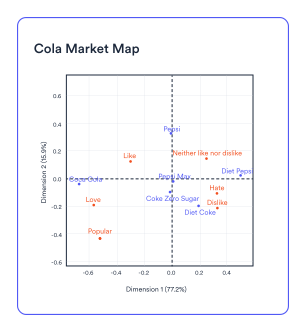
The correspondence analysis has been specifically designed to be perfect for analysis and presentation of brand association data , allowing for the entirely automated creation of market structure maps, showing which brands compete with who, how the big brands are, and the bases of their competition.
Deals with all data types
Displayr’ s correspondence analysis can be used to analyze any data type: categorical, numeric, multiple response, etc.
Fast to use
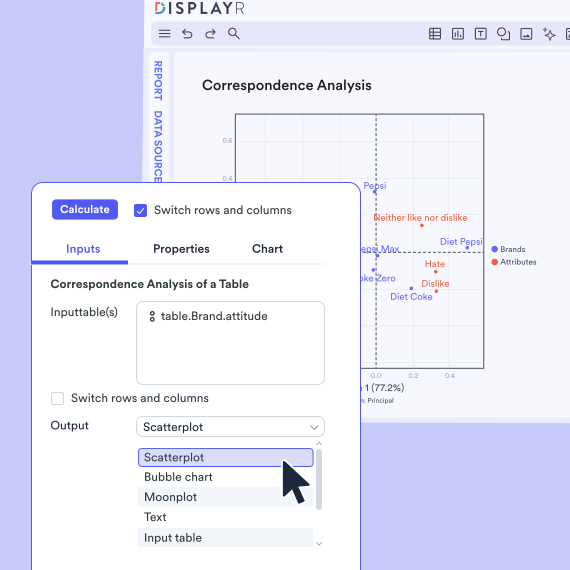
Hook correspondence analysis up to any table.
Automated updating
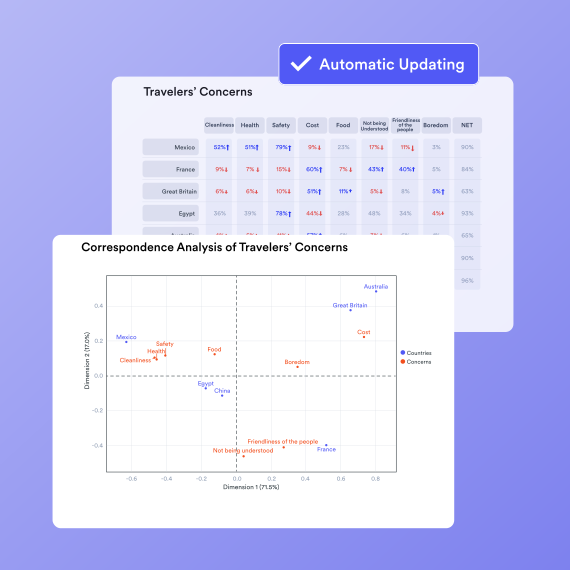
Analysis will automatically update when you revise the data, whether filtering, data cleaning, or adding in a new wave of data.
Go beyond correspondence analysis
Displayr is not just a correspondence analysis platform; it excels in every aspect including crosstabs & pivot tables, trend analysis, advanced analytics, dashboards, PowerPoint reporting, data apps, and more. Once you have your correspondence analysis, you can seamlessly integrate your insights into your reports and even update everything automatically with new insights.

President – Americas, MDI
10x faster correspondence analysis
All types of data
SQL, databases, Excel, CSV, text, SPSS, survey platforms, APIs, integrations, & more.
All types of analysis
Summary tables, crosstabs, pivot tables, regression, text analysis, segmentation, machine learning, & more.

All types of reporting
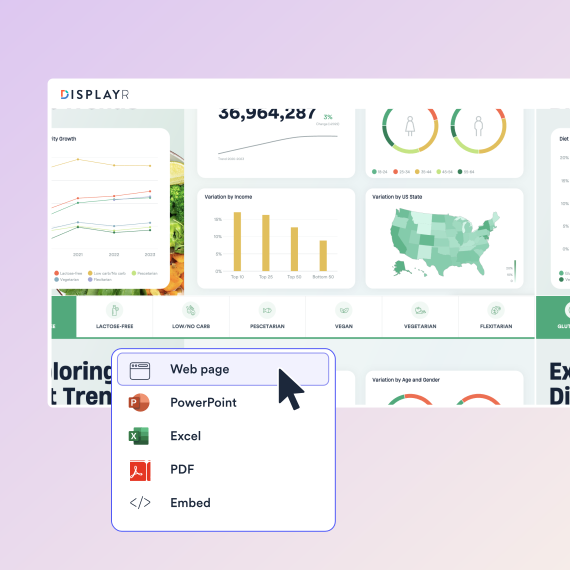
Data visualization, interactive data apps, dashboards, presentations, PowerPoint, Excel, PDF, web pages, & more.

Integrated AI
Displayr’s Research Agents integrate AI across your full workflow, from data cleaning to analysis to reporting.
Case Study - CYGNAL
Global Survey Research Company
Displayr helps Cygnal cut report creation time in half
Challenges
- Time-consuming manual processes
- A need to offer dynamic data presentations to stay competitive—and no time to create them
Solutions
- An all-in-one statistical package built for survey data with presentation and dashboarding tools
Results
- 50% time saved on data presentations and reports
- More deals closed
See why people love Displayr
Correspondence analysis FAQs
What is Correspondence Analysis?
Correspondence Analysis is a way of summarizing tables and using visualizations to make them easier to understand. It is particularly useful when dealing with tables that have too many columns/rows and have become hard to read.
How do you interpret Correspondence Analysis results?
What is the difference between Correspondence Analysis and Multiple Correspondence Analysis?
What are some real-world applications of Correspondence Analysis?
One of the most common use cases for Correspondence Analysis is in a brand perception study, as you can quickly and easily see how different competitors are viewed by respondents. Other common use cases include customer segmentation, survey analysis, and identifying patterns in categorical datasets.
Can Correspondence Analysis be performed in Displayr?
Yes! Displayr provides powerful tools for performing Correspondence Analysis, allowing users to generate interactive visualizations, interpret results easily, and integrate findings into reports with automated updates.