


Example of Choice Experiment
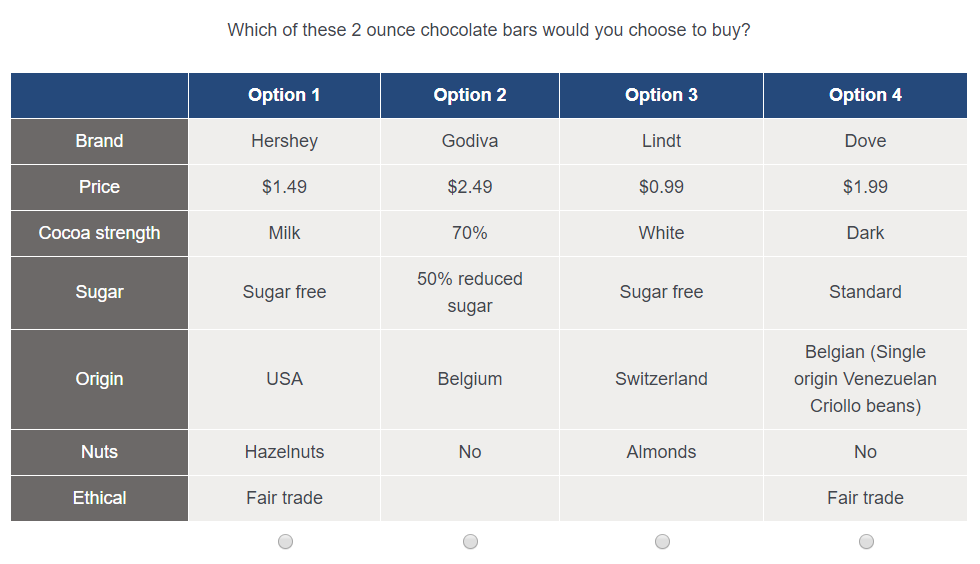
In this post I am going to use an example of a choice experiment about chocolate bars. I’ve shown a sample question below.
Let’s establish some terminology for describing choice experiments:
- Each question (also known as a task) shows the same number of alternatives. In the example, there are 4 alternatives.
- Each alternative consists of the same number of attributes. In the example, each alternative has 7 attributes.
- Each attribute has a number of possible levels. The levels are the range of values that the attribute can take. In the example, the “Price“ attribute has levels of $0.99, $1.49, $1.99 and $2.49.
- A version is the set of questions shown to a respondent. A design will often consist of many versions. Respondents are assigned a version randomly, or by round-robin.
- Each question may have None alternative(s). We have not included this in the example, but it is typically a status quo alternative such as “None of these”.
- One attribute may be used to label each alternative of a question. Typically the attribute might be “Brand”. This means that there are as many alternatives per question as there are levels in the labeling attribute. Each level of the labeling attribute is used in one alternative per question. This is also not used in the example, “Brand” is a regular attribute (and so levels may be duplicated within a question).
- Prohibitions are groups of attribute levels that cannot be shown together in the same alternative. We have not used prohibitions here, since they are not possible with all algorithms and make a more complex experiment.
Creating an Experimental Design
An experiment can be created in Displayr from Insert > More > Conjoint/Choice Modeling > Experimental Design and Q from Automate > Browse Online Library > Conjoint/Choice Modeling > Experimental Design. The image below shows the setup of the design we are going to use.
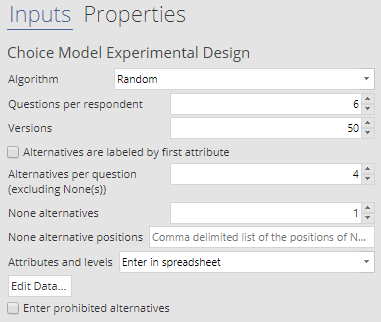
Besides the inputs already described, there is a choice of 3 ways to enter the attributes:
- Enter attributes individually. In each of the subsequent boxes, enter an attribute label followed by its levels, separated by commas. E.g. “Nuts, Almonds, Hazelnuts, No”.
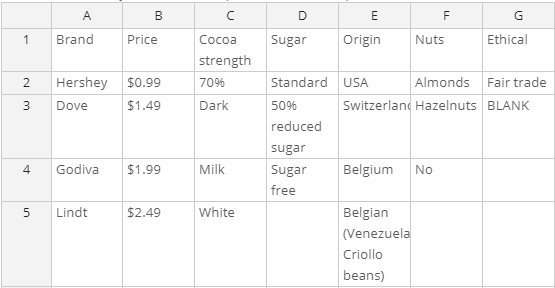
- Enter in spreadsheet. The example above uses this approach. Each column has one attribute, with the attribute label in the first row and levels in subsequent rows.

- Enter the number of levels per attribute. This is a quick way of setting up an experiment just by listing the number of levels of each attribute. Displayr assumes the attributes and levels are integers.
There are 8 different algorithms available. In this post, I am going to describe the first 4. See the following posts for others:
Random Algorithm
The simplest procedure to create a design is to randomly choose a level for each attribute in each question. This is exactly what the random algorithm does. There is only one additional piece, we ensure that identical alternatives do not appear in the same question.
Shortcut Algorithm
This is a relatively fast algorithm that builds a design by repeatedly adding attribute levels. For each attribute of each alternative of each question, the algorithm adds the least frequently used level to the design. If multiple levels are used equally frequently in the question, it adds the least frequent level in the overall design so far. In the event of a tie after all this, the algorithm makes a random choice.
This algorithm is called “Shortcut” because, unlike the next two, it only considers level frequencies and not pairwise balances.
Complete Enumeration and Balanced Overlap Algorithms
Like “Shortcut”, these are greedy algorithms that repeatedly add an optimal level to the design. When selecting the optimal level, they consider the frequencies like “Shortcut”, but they also incorporate 2 other aspects,
- The pairwise frequencies, i.e. how often each pair of levels from different alternatives appear in the same alternative. For example, how often “Origin” is “USA” and “Ethical” is “Fair trade”. Intuitively, a good design should show all the combinations of pairs. On the flip side, we would consider a design poor that always shows the same combination, like “USA” and “Ethical”.
- The overlap between alternatives, whereby the same level appears in multiple alternatives of the same question. “Compete Enumeration” reduces this overlap, in favor of a design with better frequency and pairwise balance. “Balanced Overlap” allows more overlap, with the idea that respondents make better decisions when comparing alternatives with some degree of similarity.
Which algorithm is the best?
You can see models created by the 4 algorithms for the chocolate experiment in this Displayr document. It’s natural to follow up this description with the question of which algorithm is best. There are several approaches to answering that question, which luckily we cover in the following posts!
D-error is a common metric of design quality. We describe its calculation in Displayr, Q, and R.
Balance and overlap metrics allow information about frequencies and pairwise frequencies to be condensed into easy-to-use numbers. These are also shown in this Displayr document.
Simulated data can be used to fit a model, which allows measurement of prediction accuracy and parameter errors.
Find out more about Choice Model Experimental Designs on our Displayr blog. Want to do this yourself? Start your free Displayr trial here, the best choice modeling software out there.
