In reality, the investment most organizations make in tracking research necessitates detailed and regular multi-page reporting, to extract full value from that investment for all stakeholders involved.
However it’s also handy to be able to distill tracking data to a single page of KPIs, as a “topline” view for a wider or senior executive audience.
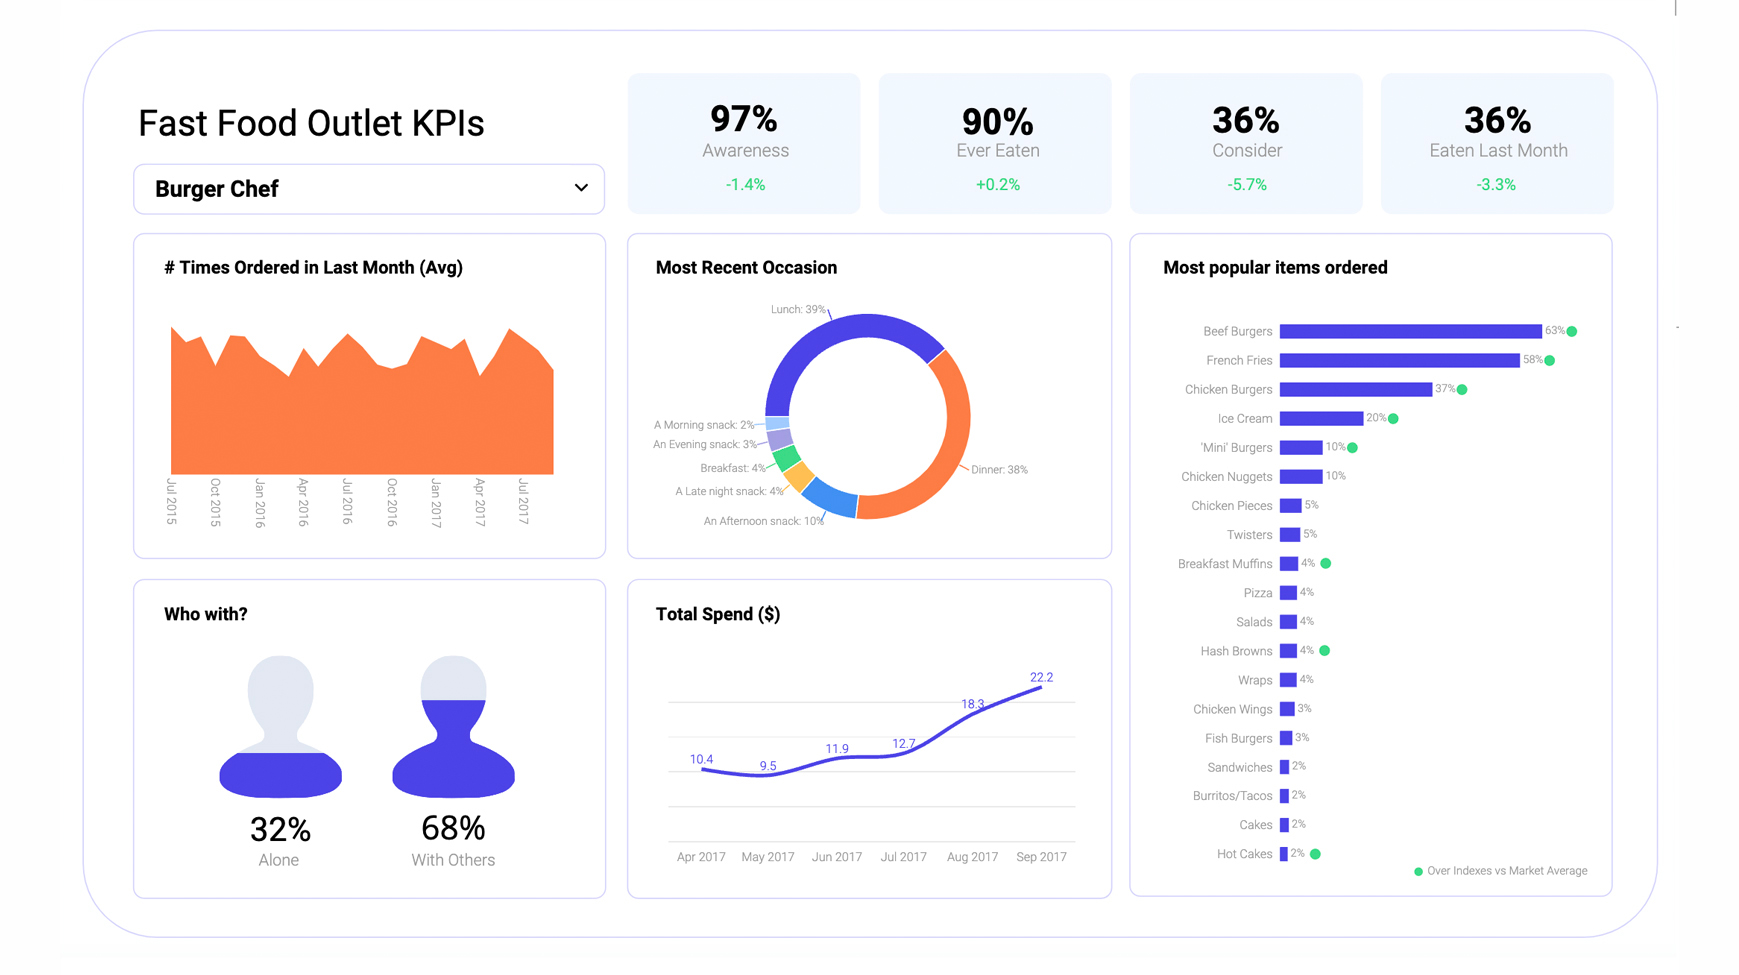
Displayr makes this super-easy to create, publish, and share. This one-page tracking KPI dashboard was created in just a few hours and brings together over 20 metrics, as well as some calculated indices. Even the drop-down filter query, which instantly changes the view to any of the 14 brands or categories, only took a few minutes.
What’s more, the entire dashboard is updated automatically when new data is added, eliminating some of the key “cut and paste” pain points that come with regular reporting.