
Checking for statistical significance is a crucial part of any statistical analysis. With Displayr’s built-in significance testing, separating signal from noise is a breeze.
Analyzing customer feedback survey data requires the use of statistical significance testing. Here are three instances where Displayr automatically tests for statistical significance.
Built-in significance testing with Displayr
Cross-tabulations
Every time you create a cross-tab with Displayr, statistical significance is calculated behind the scenes and the results are displayed in the output. Statistically significant results are color-coded and accompanied by an upward or downward arrow, which indicates the direction of significance.
The above table compares Net Promoter Score data across four regions: Australia, USA, UK, and Other. The cells show the percentage of respondents for each category. Without statistical significance testing, we may be tempted to focus on the fact that Australia has the highest NPS (80.8) and the highest percentage of promoters (83%). After all, that seems like a valid conclusion and a useful insight.
However, those would be misguided conclusions. While Australia has a higher NPS than the other countries, the difference is not statistically significant. This means that there isn’t enough evidence to be confident that the average NPS from Australian respondents is significantly different to respondents from other countries.
Instead, we should focus on the results that are statistically significant: Australian detractors and American detractors. Only 3% of Australian respondents are labeled as detractors, while 9% of Americans are labeled as detractors. These are the only two statistically significant results in the cross-tabulation. From this, we can conclude that Australia has significantly fewer detractors than other countries, and the US has significantly more.
Charts
Many charts in Displayr are created with already-computed significance checks. Much like the cross-tabulation output, these figures are straightforward to interpret. The arrows denote whether the outcome is statistical significance and the direction in which it is significant.
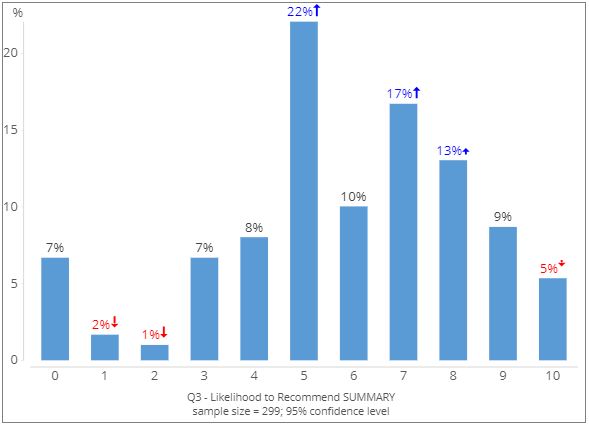
The charts above show the distribution of Net Promoter Scores. The results show that the high percentage of detractors and the low rate of promoters are statistically significant. There is also a disproportionately high number of respondents who gave a score of 5 (22%), 7 (17%), and 8 (13%). On the other end of the spectrum, responses of 1 (2%), 2 (1%), and 10 (5%) were significantly low.
Statistical models
Let’s end with a slightly more advanced example. Every time you run a regression analysis with Displayr, the p-values are computed and presented in a way that is easy to interpret. Variables that are significant at the 5% level (p < 0.05 ) are listed in bold and their estimate coefficients are colored either red or blue, depending on their value.
The regression output above is from a driver analysis of a tech company’s Net Promoter Scores. The aim of the regression model is to identify which brand perception attributes — fun, innovative, stylish, etc. — influence NPS responses from customers. We can see that there are only four brand attributes that can be considered statistically significant drivers of NPS. By making use of Displayr’s in-built statistical significance tests, we can make some advanced inferences about the behavior and attitudes of our customers.
Try it yourself
Testing for statistical significance is a breeze with Displayr. Click the button below for a step-by-step tutorial.
Learn how to statistically test Net Promoter Score in Displayr