


In the example I will use here, I have three key sample profiling metrics that I want to provide in a bullet point list: population, Internet penetration and household income. In addition, I want to create a dynamic list so that I can filter by specific segments in my data. To do this in Displayr we will:
- Produce the source tables
- Create the dynamic bullet-point objects
- Create filters
- Publish the page
Click here for an interactive tutorial on creating dynamic text
Creating the source tables
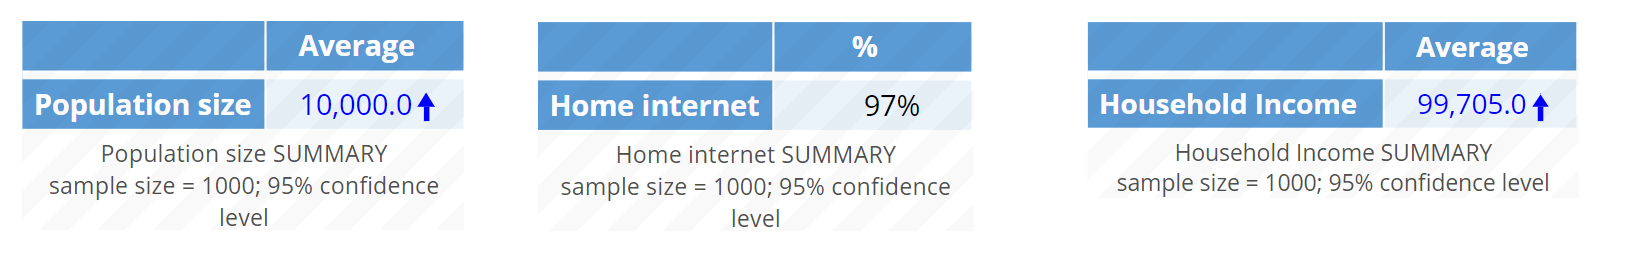
I start by dragging each of the three variables from the Data Sets tree onto the Page. The Population and Household income variables are numeric and therefore automatically display an average. The Home Internet variable is a “Yes/No” binary variable structured as a Multiple categories (Binary – Multi). Thus, a single value is counted rather than individual categorical values (1 and 0).
I’ve selected each of the three tables and ticked the Hidden from exported views checkbox in the Properties section of the Object Inspector (on the right side of the screen). Now that I have the data tables I need, the next step is to create the bullet-point objects using some R code.
Creating the bullet point objects
First, I add an R Output to my page by selecting Insert > R Output (Analysis) from the menus. This adds an blank R Output object to my Page. Here we’ll add code that will generate the various components of each bullet point item, including the bullet point itself, a value from one of the tables and the value label. To combine each of these items into a text output, we use the R paste() function.
The paste function is used to concatenate values together in R. The basic syntax is as follows:
paste(item1, item2, item3,...)
This will combine all of the items into a single string. By default, the paste function will enter a space separator between each item. You can add the optional sep argument to the function in order to explicitly state the separator. For example, to remove the separator, set the sep argument to double quotes with no space (“”).
paste(item1, item2, item3,..., sep="")
The first item we want to add to the R output is the bullet point. To create this we can use a unicode character preceded by a backward slash (\). When we use backward slashes in strings in R, it signals to R that what is directly after \ should not be interpreted as text. Unicode is a standard developed by the non-profit Unicode Consortium that assigns a unique numeric value to specific letters, numbers, punctuation, symbols and icons across multiple languages that can be used and recognized across any platform or operating system. The Unicode character for a bullet is U2022. A detailed list of available Unicode characters can be found here.
Notice that I’ve used the sep argument here to remove the automatic space so that there is no space between the $ and % symbols and manually added spaces where I do want them to appear.
Adding values to the bullet points
We can now use the paste function to combine the bullet point, the value from the first table (Population Size) and the label.
a <- "\U2022"
pop <- table.Population.size[1][1]
bullet.1 <- paste(a,round(pop,0),"population")
Note I’ve also used the round function on the population variable to round the returned average to zero decimal places. Click the Calculate button run the R code.
![]()
You can replicate this code for both the Home Internet and Household Income variables.
a <- "\U2022"
internet <- table.Home.internet[1][1]
bullet.2 <- paste(a," ",round(internet,1),"%"," Internet penetration",sep="")
a <- "\U2022"
income <- table.Household.Income[1][1]
bullet.3 <- paste(a," $",round(income,0)," household income",sep="")
Finally, the three bullets can be combined together by another application of the paste() function. This time, the separator will be a new line character \n.
my.list <- paste(bullet.1, bullet.2, bullet.3, sep = "\n")
With a bit of formatting I get the following bulleted output:
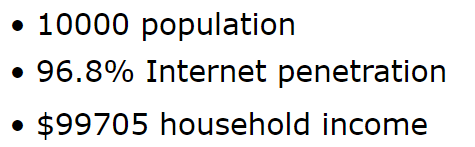
Formatting options are available in the Properties section of the Object Inspector under APPEARANCE. Here you can modify things such as the font style, font size, color, border, etc.
Creating filters
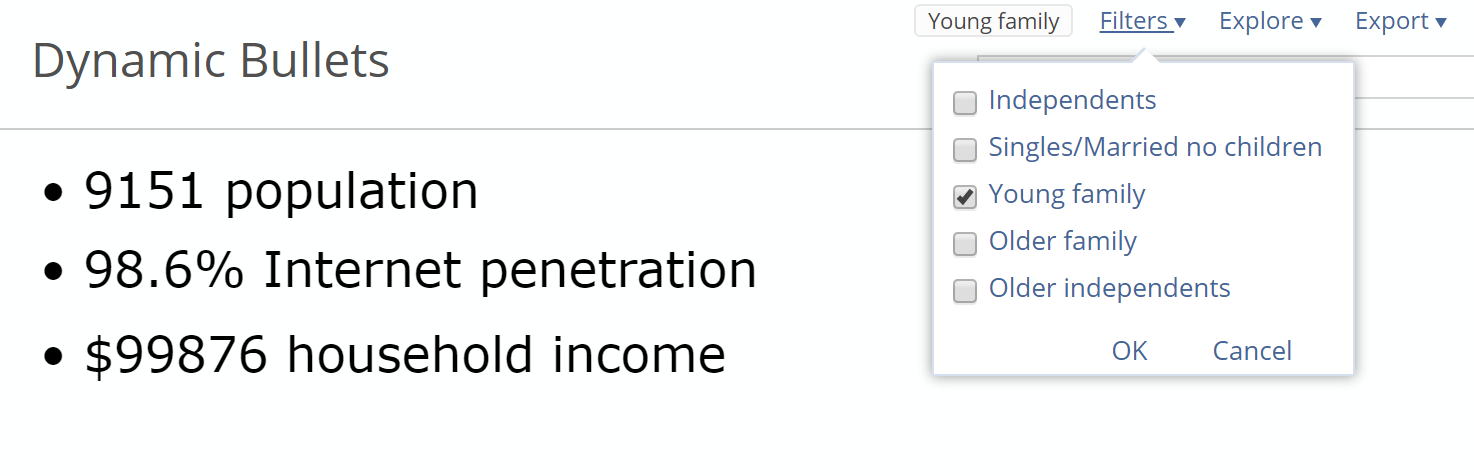
Next, I want to create filter using a Life Stage segmentation variable. To do this, I select the Life Stage variable in the Data Sets tree and from the menus select Insert > Filter > Filters from Selected Data. Displayr creates new filter variables and adds them to my Data Sets tree. These new variables are automatically available to be used as a filter (the Usable as a filter checkbox is ticked automatically in the Object Inspector when the filters are created. You can read more on filtering in Displayr here.
Publishing the page
Lastly, to publish the page select the Export > Web Page drop-down, tick the Hide navigation pane checkbox and then select Export. You can dynamically filter the resulting web page output by any of the Life Stages filters. The bullet point list will update accordingly.
Want to do more in Displayr? Check out the R in Displayr or Using Displayr sections of our blog!
