


What is a Top 2 Box Score?
A Top 2 Box score is a common means for reporting results of categorical scale questions in which the top two responses are combined. For example, we can use the following 5-point satisfaction scale:
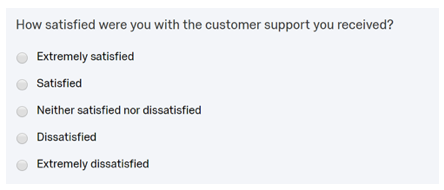
In this case, the first option in the scale (Extremely satisfied) is referred to as the top box and the percentage of respondents who selected this option is called the Top Box score. Pretty simple right?
Likewise, the Top 2 Box score is the percentage of respondents who selected either the top box (Extremely satisfied) or the second box (Satisfied) response. Thus, the Top 2 Box score is the percentage of respondents in the sample who have expressed some level satisfaction.
This statistic may be the most important part of your visualization if you want to focus on the positive responses. Limiting the data points in your visualization will keep your output from getting cluttered and allow you to focus on the most vital information.
In this post, we look at how to add a top box score to a table and how to change the structure of data so that only the top box score is shown.
Creating a top 2 box score on a table
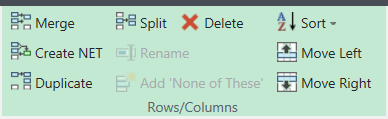
The most direct way for creating a Top 2 Box score in Displayr is through merging categories or creating NETs on a table. Start by dragging a variable set from the Data Sets section and on to your page to create a table. For more on creating tables in Displayr, see Introduction to Displayr 3: Creating Tables, Charts, and Other Visualizations.
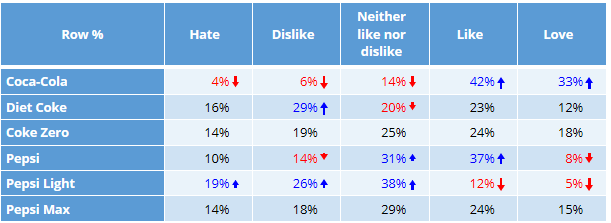
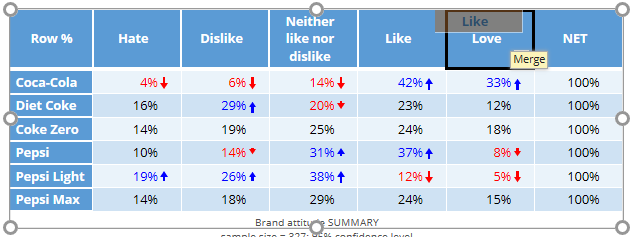
Using the following table, we can drag and drop the second box response (Like) onto the top box response (Love):
Once one category is placed over another, the word “Merge” will appear.
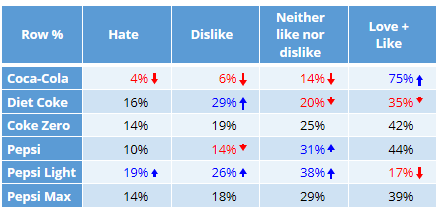
Displayr will then name the merged categories as “first category + second category”:
You can now rename the category if you want. To do so, select the category name, select Rename from the Data Manipulation tab, type in the desired text, and click Rename.
If you want to show the individual categories as well as the Top 2 Box score on one table, you will need to create a NET. You can do this by selecting the 2 categories (by holding down the CTRL button) and selecting Create NET from the Data Manipulation ribbon menu.
Creating a top 2 box score by changing the structure
The other means for creating a Top 2 Box score is to change the structure. Changing the structure of a variable set allows you to control how Displayr understands the data. For top boxes, the appropriate structure is Binary – Multi. For more on how to understand how Displayr structures and understands your data, see Understanding Variable Sets in Displayr: A Tutorial.
To restructure the data:
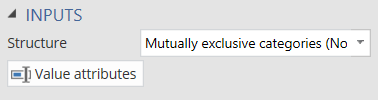
- Select the Variable Set in the Data Sets section in the bottom left.
- On the right, change the Properties > INPUTS > Structure to Binary – Multi.

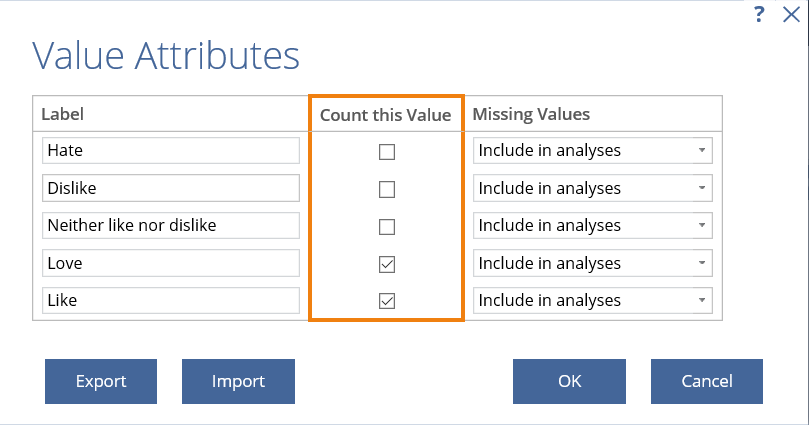
- Next, click the Value attributes button and only select the 2 Top Box categories in the Count this Value column.
- Click OK.
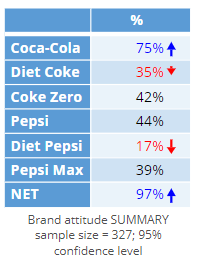
The question will now only display the Top 2 Box score when used in a table.
We hope you found this guide helpful! For more tips check out the Market Research or the Using Displayr sections of our blog.
