


In this post, I will show you how to create a PowerPoint report using Displayr.
The idea is to get the vast majority of analysis and data outputs created in Displayr before exporting the document to PowerPoint and finalizing the report. I will also show you an easy way to make changes and update your PowerPoint reports.
This approach can be used to create one-off reports quickly and efficiently, but it’s particularly powerful for setting up and automating projects that require regular reporting, such as tracking studies or multi-country projects.
Depending on the design requirements you can either create a new Displayr template or use an existing template. Alternatively, you can skip this step and instead use a PowerPoint template. In the below example I will use the latter approach. All you need to get started is a Data Set and a PowerPoint document template.
Step 1: Create a new document
- Create a new Displayr document
- In the Ribbon, choose Insert > New Data Set and select the data file you wish to use.
Step 2: Create a page of results
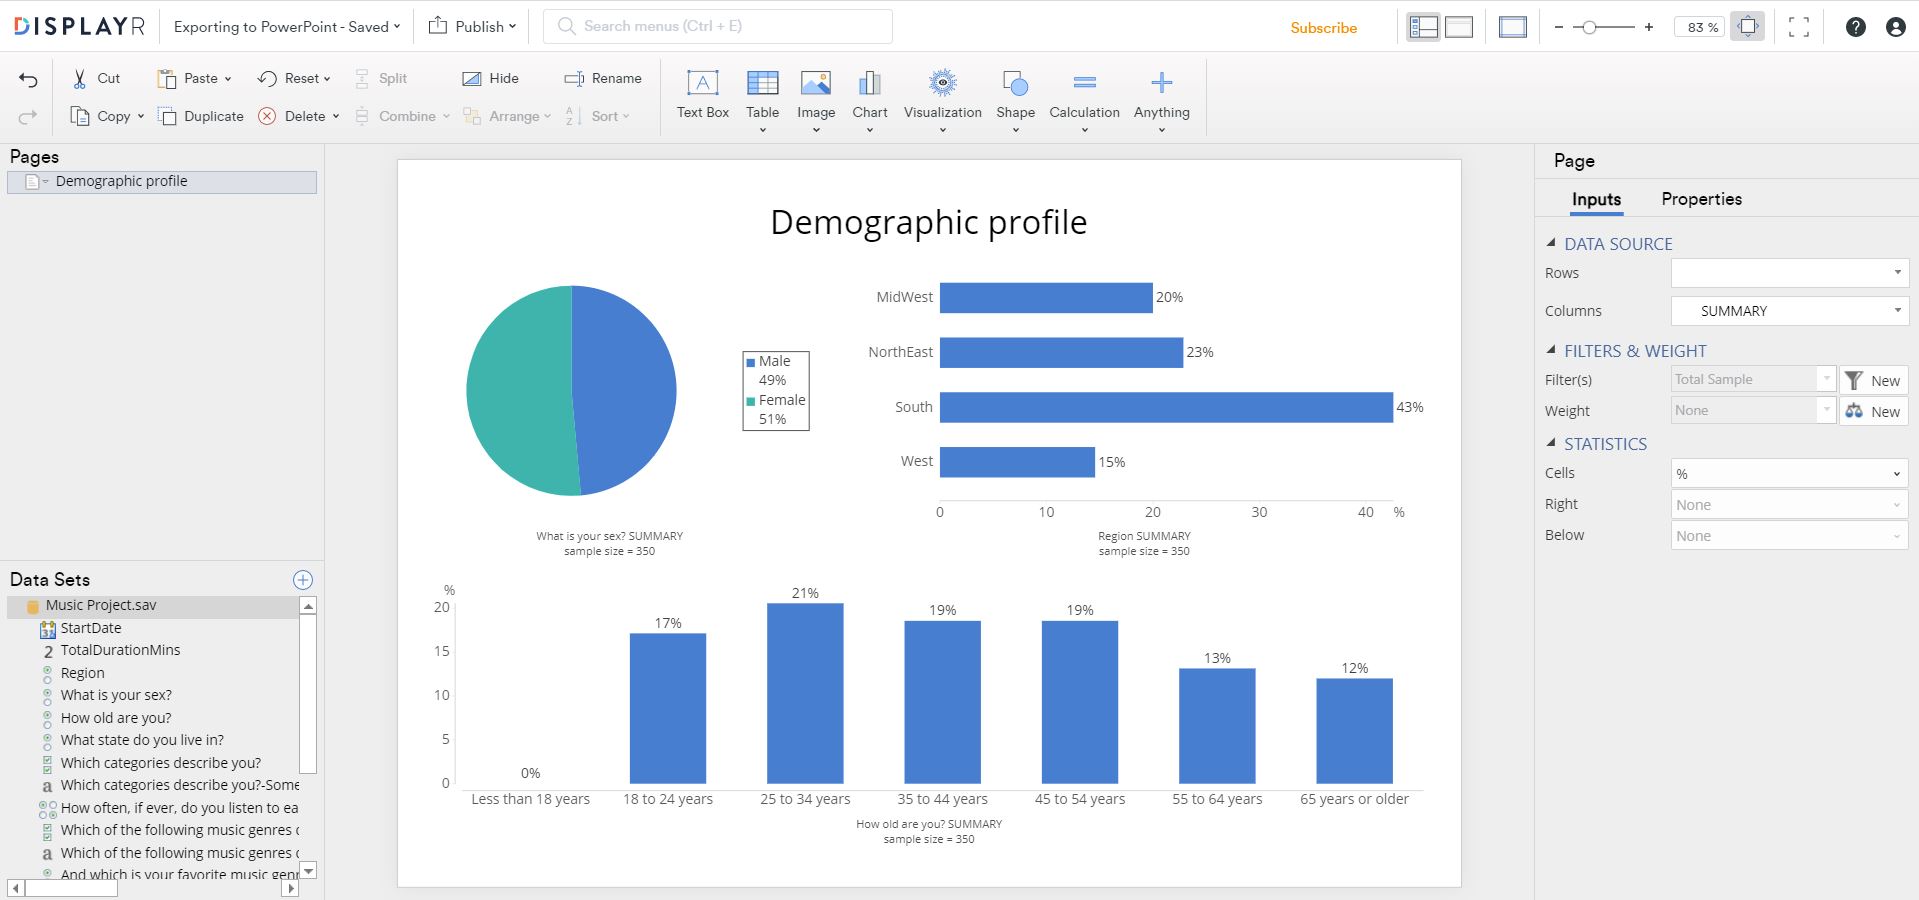
In the example below I created a page containing demographic information. I created three different charts for Gender, Age, and Region.
Step 3: Change the PowerPoint export format settings
By default, charts will be exported to PowerPoint as static images. However, once exported to PowerPoint I want to be able to edit the charts.
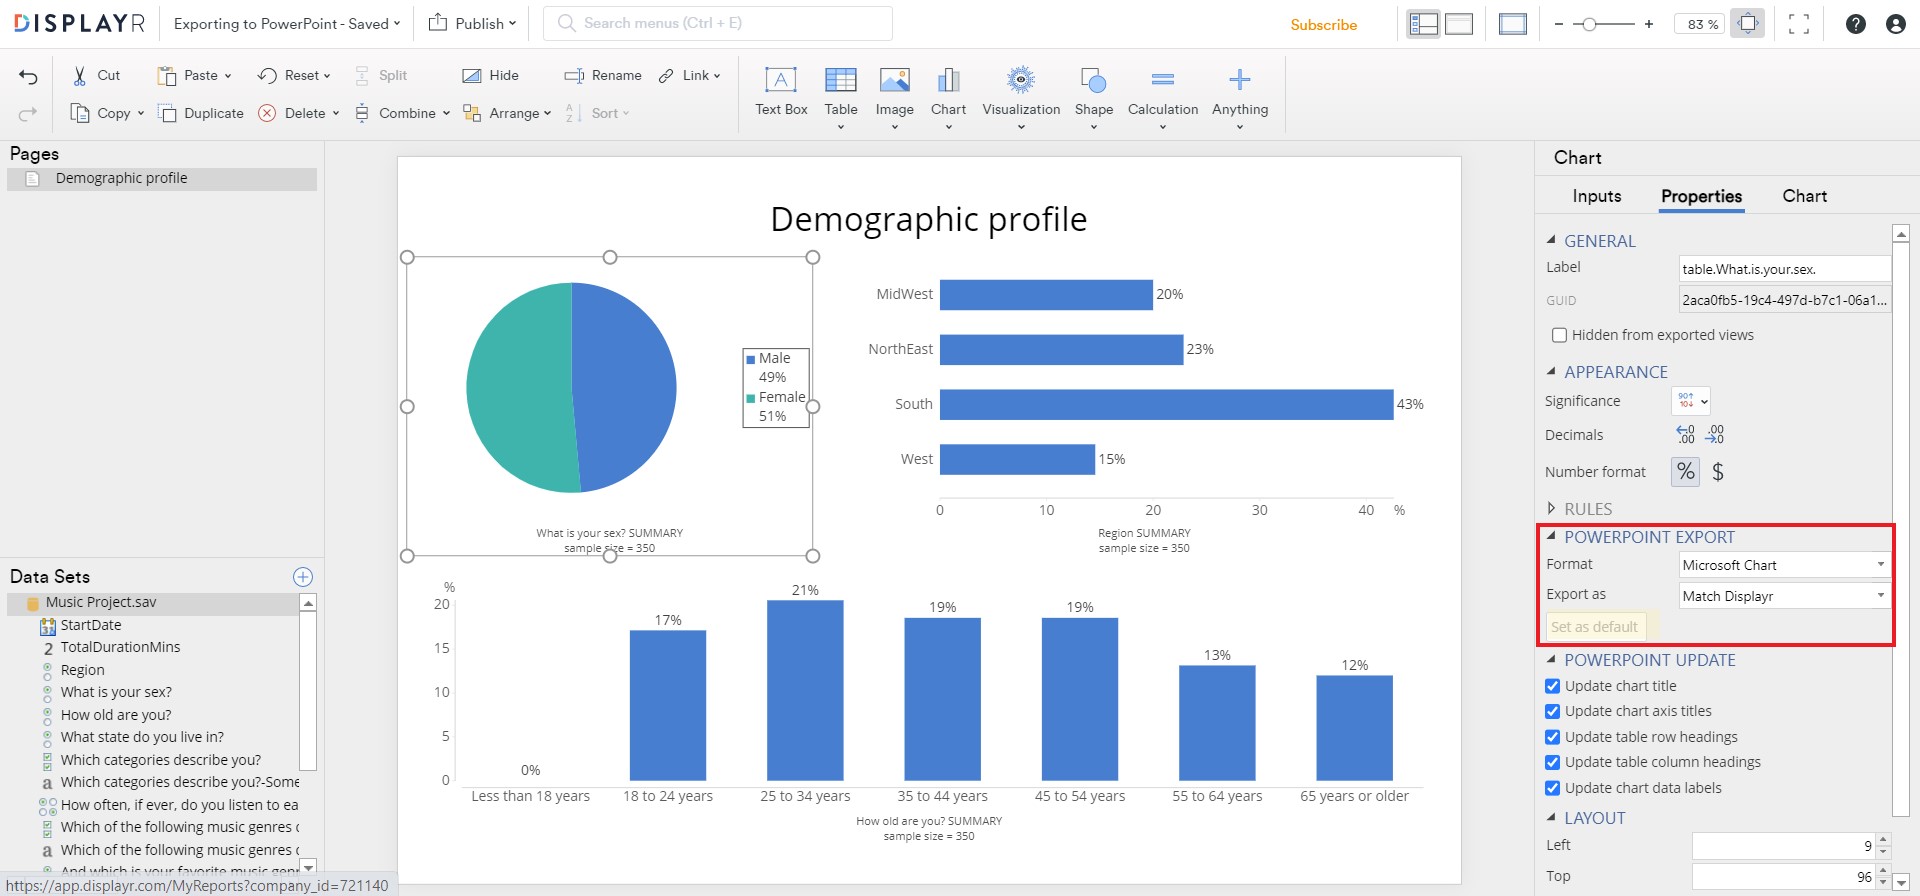
- To change the default setting and export all charts as editable charts, I need to change the export settings by selecting the chart and going to the Object Inspector > Properties > POWERPOINT EXPORT > Format and selecting Microsoft Chart.
- Next, I want all the charts to be exported using the style of charts selected in Displayr. I can do this by changing Export as under Properties > POWERPOINT EXPORT > Export as to Match Displayr.
- To apply the change to all charts in the document, I selected Set as default.

Note, if I selected a specific chart type, such as 3D Pie, from the Export as menu and then clicked Set as default, all charts in the document would be exported to PowerPoint as pie charts.
Step 4: Export to PowerPoint
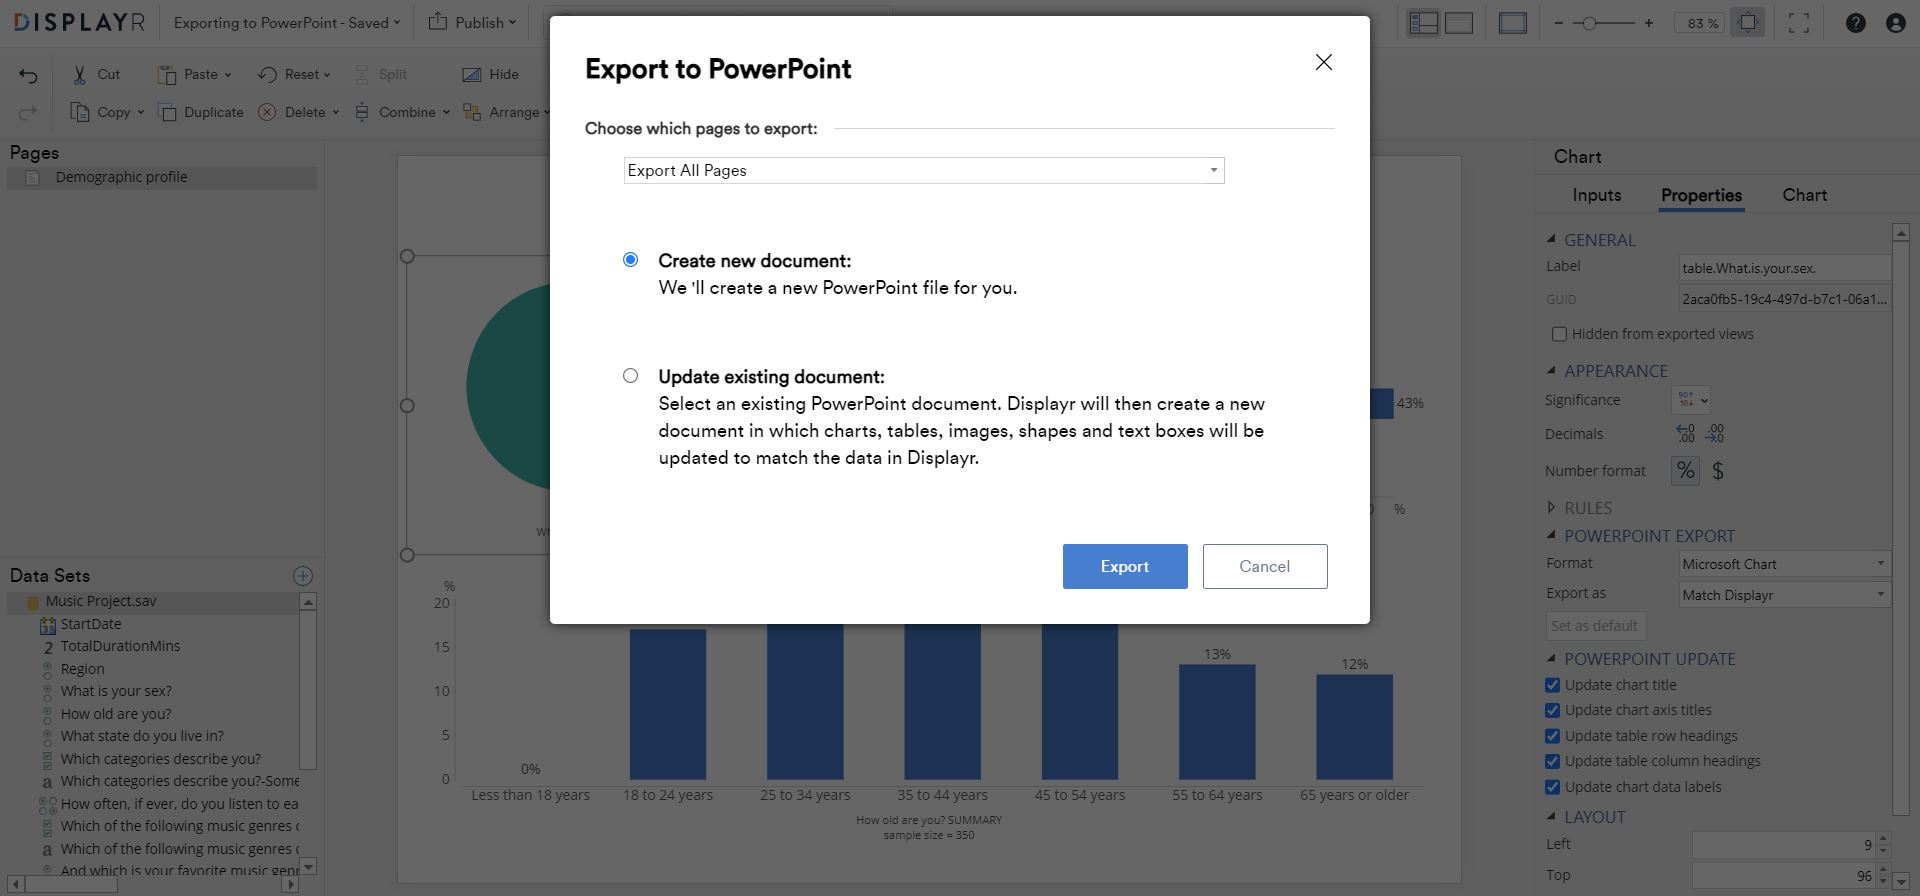
- Select Publish > Export Pages > PowerPoint > Create new document > Export.
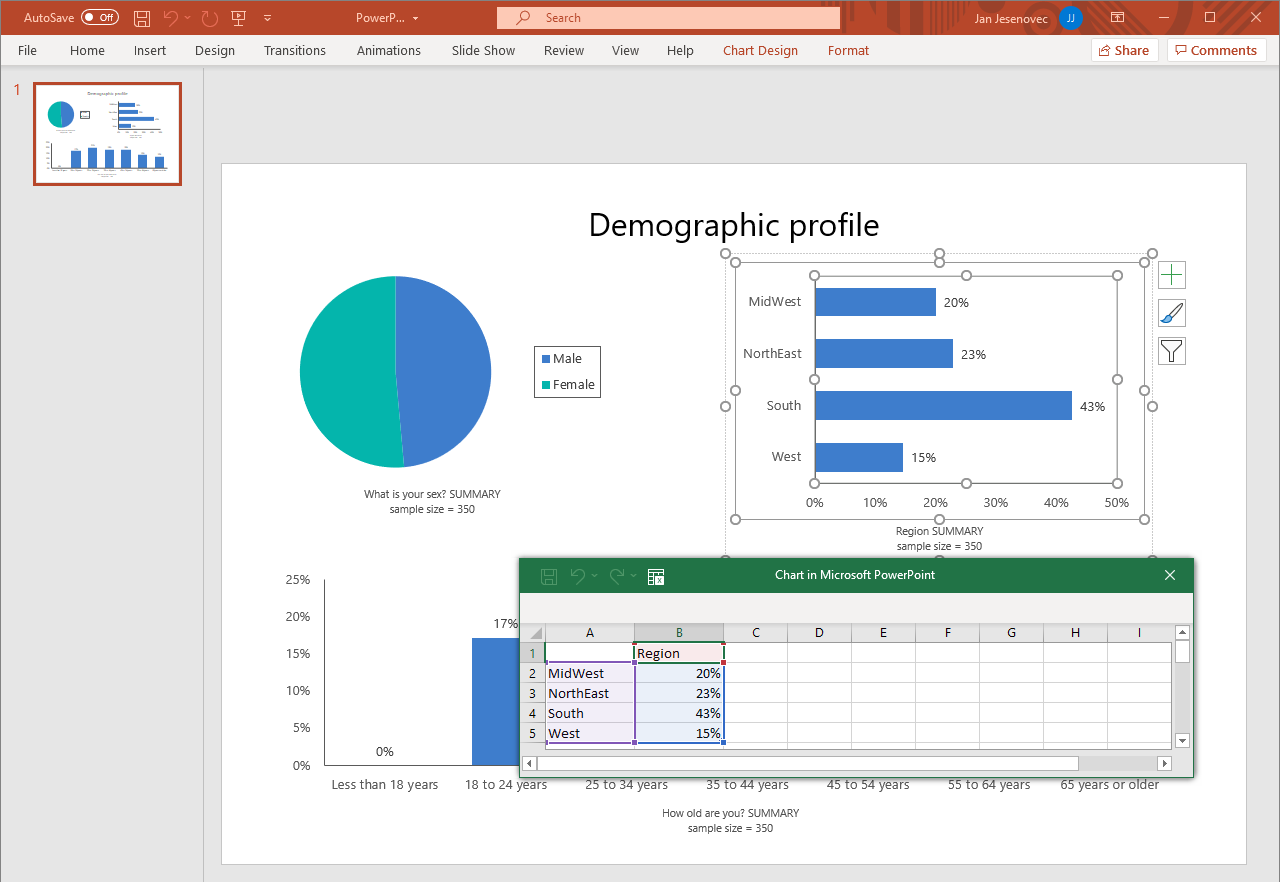
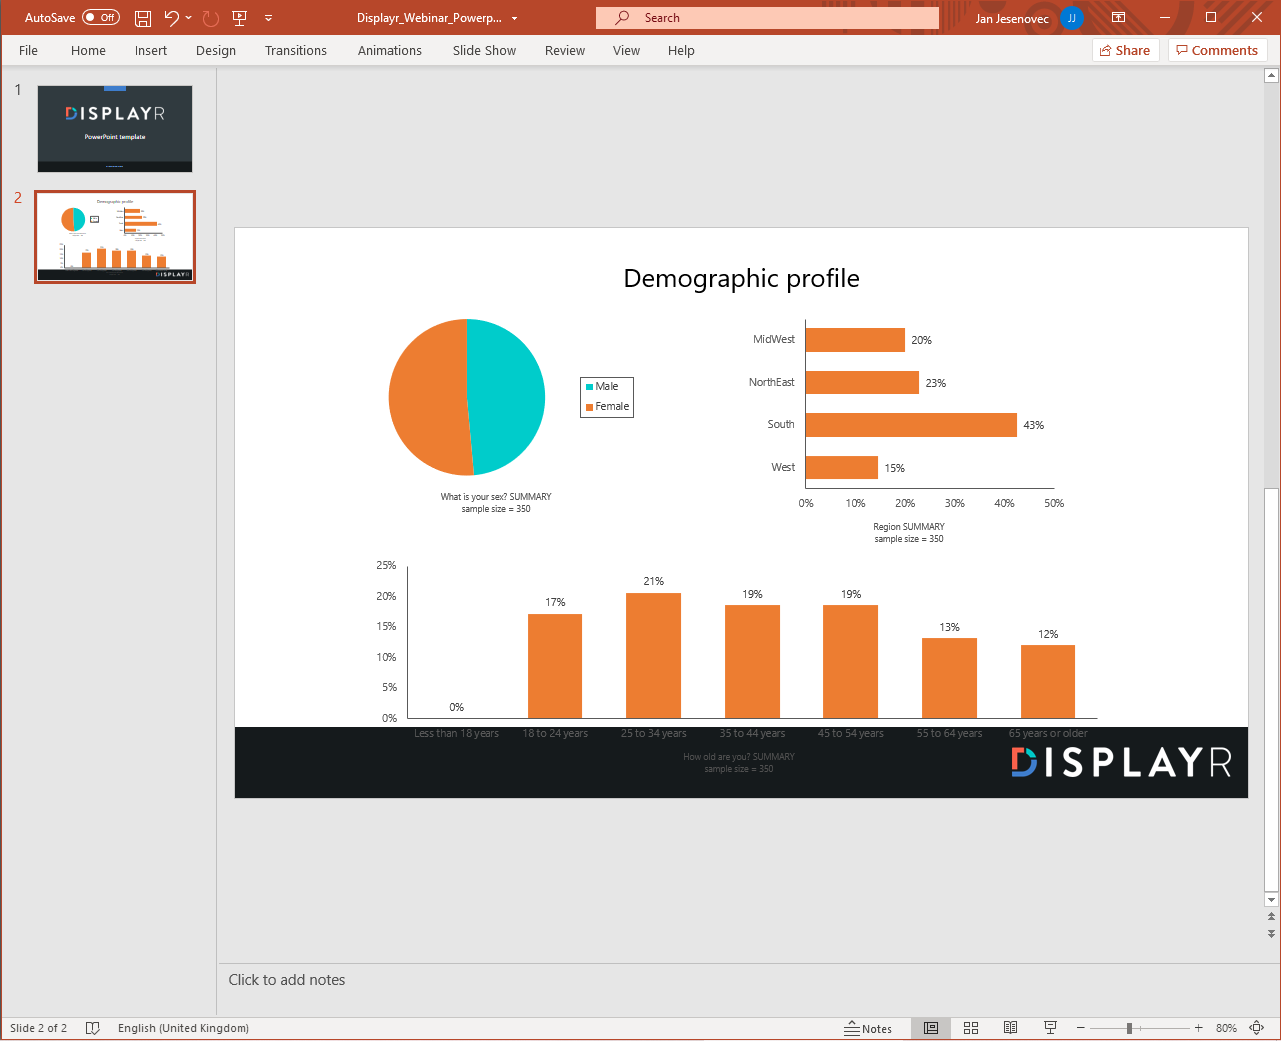
Displayr will export the page as a PowerPoint document placing each page of the Displayr document on an individual slide. In this case, I have exported only one page, resulting in one PowerPoint slide. The slide consists of the text box and three editable charts.
Step 5: Transfer the slide to your PowerPoint template
The exported PowerPoint document matches the design and layout of the Displayr document. However, I wish to use a different PowerPoint template. As mentioned earlier, it is possible to set up a specific template in Displayr, but for the purpose of this post, I want to show you how simple it is to use a pre-existing PowerPoint template, such as your company’s or your client’s template.
To do that, I opened my PowerPoint template and copy-pasted the slide from my exported document to my template. By default, PowerPoint inserts the slide using the Destination Theme Paste option – applying the template design. In our example, the chart colours changed.
Step 6: Modify the slide in PowerPoint
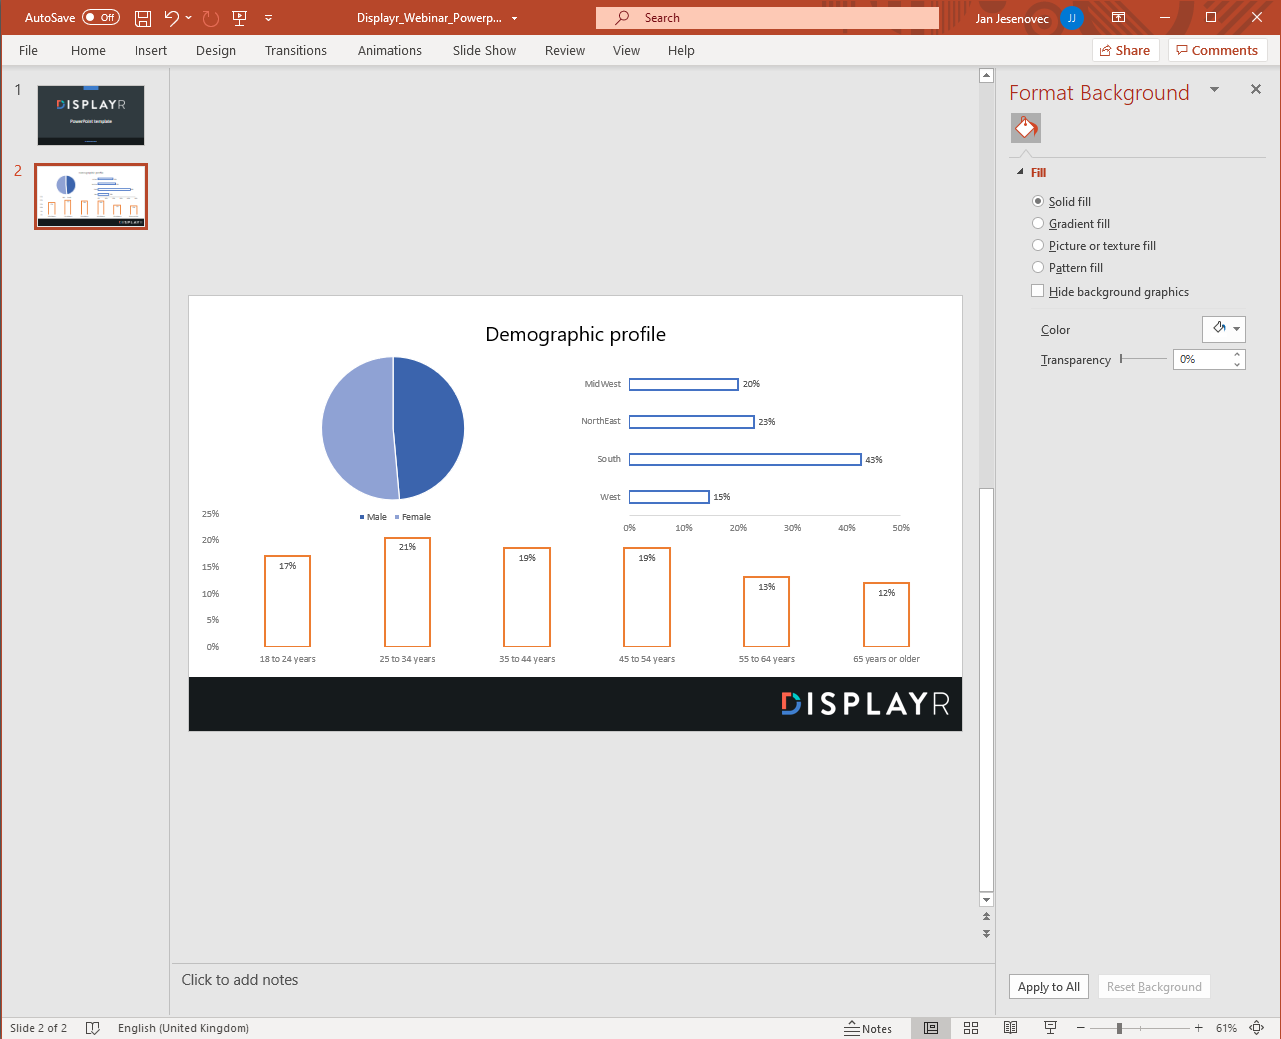
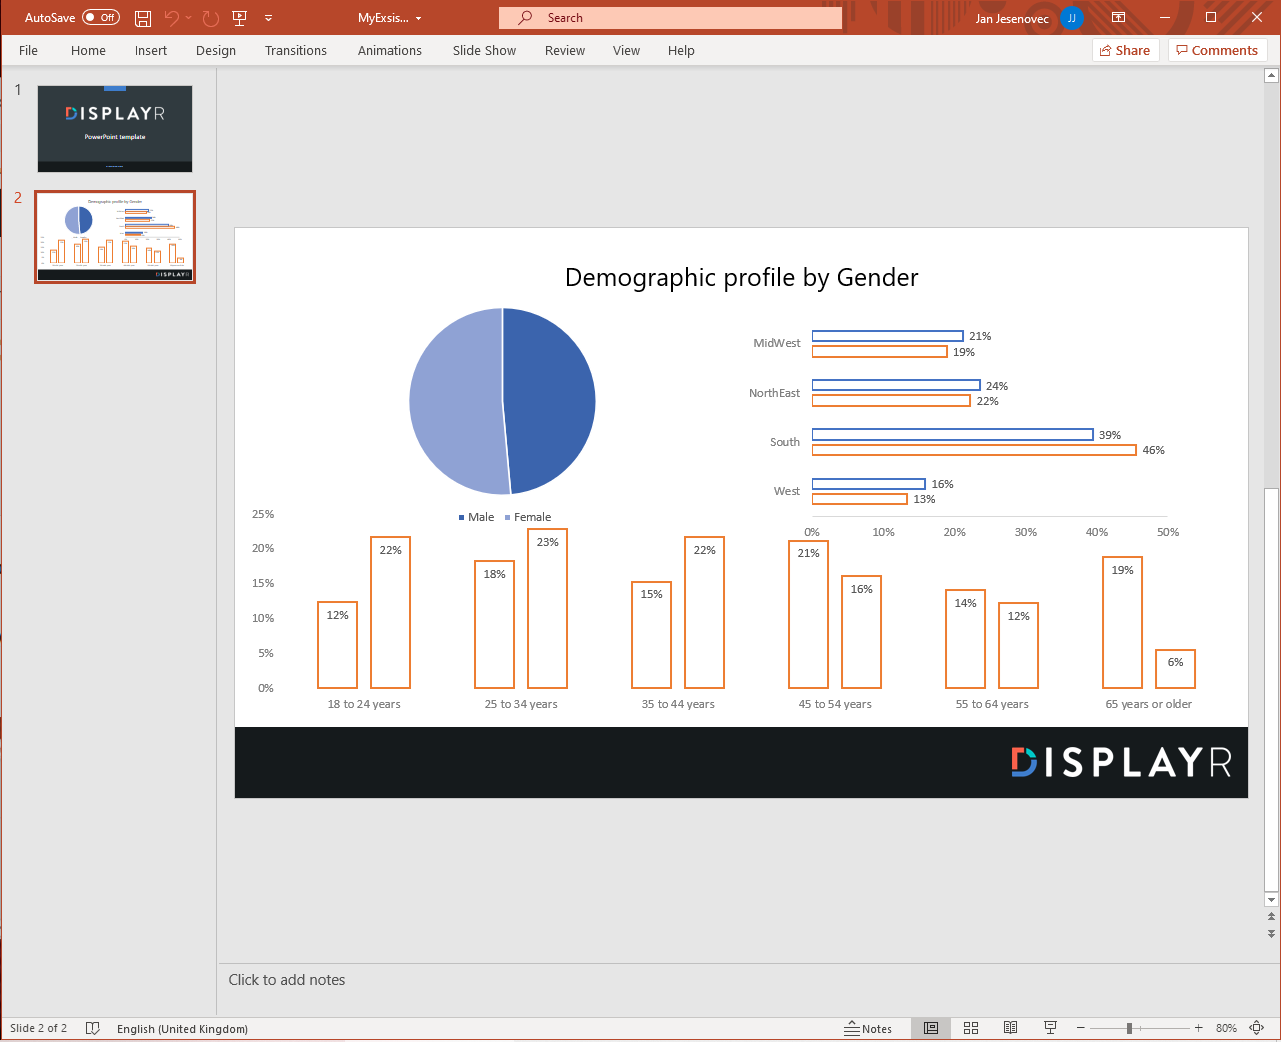
For this particular example, I have resized and moved the charts around. I also removed the question text and base information, hiding the ‘Less than 18 years’ data series, and changing the Chart Type designs in PowerPoint.
Whilst I could have done most of these changes in Displayr, the aim of this example is to show that this can also be done in PowerPoint without losing the ability to update the charts at a later time and keep the design intact. My PowerPoint slide now looks like this:
Step 7: Making changes to the PowerPoint report
Now, let’s say that we wish to make a change to our report and show Region and Age split by Gender. I could do this by going to my data tables, finding the data, and manually adding it to the PowerPoint chart. After all, we can edit the chart exported from Displayr.
But there’s a better way: I can make the change in my Displayr document and Displayr will update the report for me.
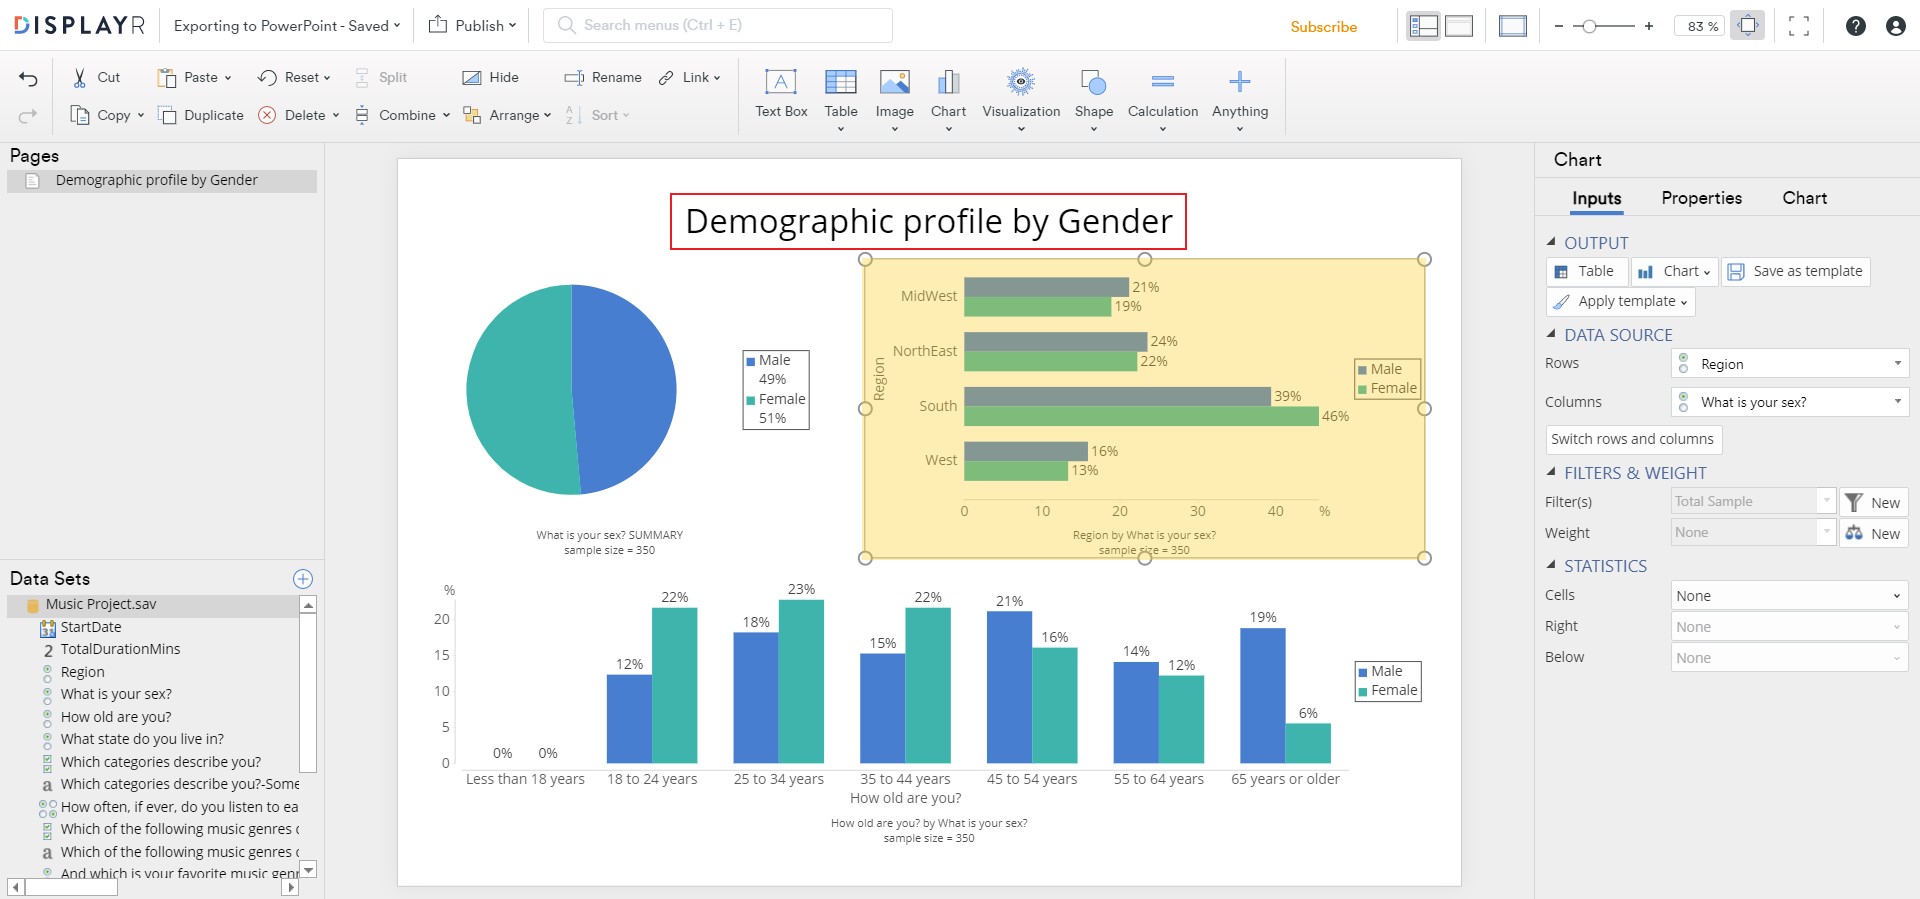
To make the change, I returned to my Displayr document, selected my Region chart, and added Gender by going to the Object Inspector > Inputs > DATA SOURCE > Columns.
I then repeated the same process for my Age chart to get the below output.
I also updated the title text, adding the words by Gender, to reflect the updated charts.
Step 8: Updating the PowerPoint report
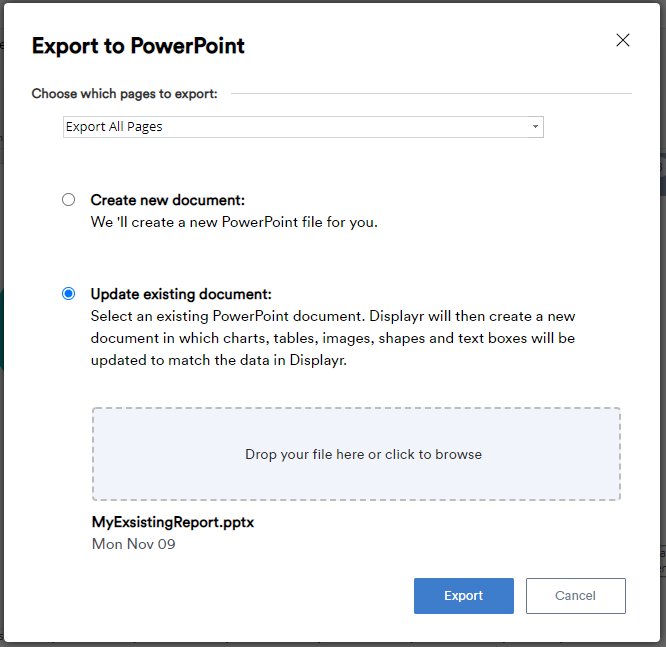
To update the PowerPoint report, go to Publish > Export Pages > PowerPoint, but this time instead of creating a new document I selected Update existing document. I then dragged and dropped my PowerPoint document created in Step 6 into the blue box and clicked on Export.
Displayr updated the document and a pop-up window appeared containing information on the changes made.
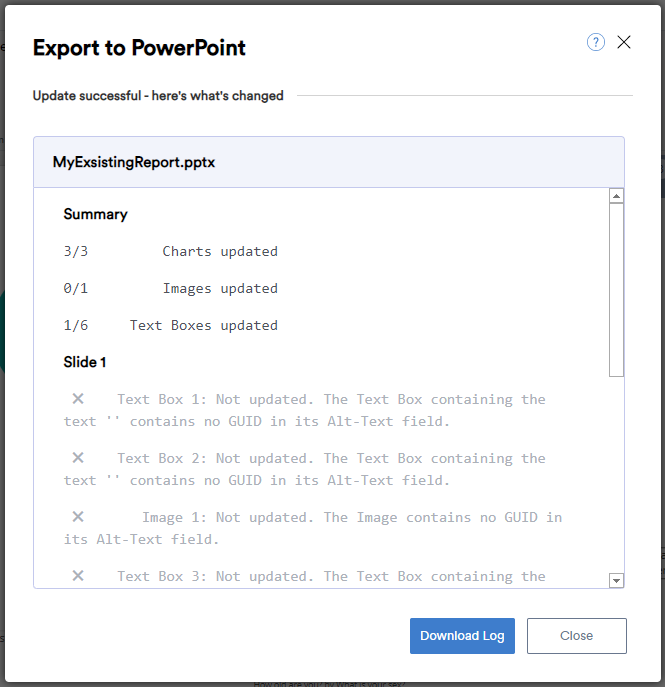
In this example, Displayr updated the text box and three charts as per the below. The updated document reflects all the changes we made to our document during the previous step.
The approach outlined above has a wide range of uses, from running analysis and creating a single PowerPoint report to full-scale automation of PowerPoint reporting.
In the next blog in this series, I will show you how to make changes to your PowerPoint reports built-in Displayr.
If you have any questions or need help you can always contact the technical support team by dropping them an email at [email protected].
