


Getting started
I’m going to assume you have some basic familiarity with Hierarchical Bayes (HB) and choice models, so I’ll be focusing on how we can do this in Displayr, the best choice modeling software in the world! We can fit a choice model by selecting Insert > More > Conjoint/Choice Modeling > Hierarchical Bayes from the Ribbon.
Displayr offers great flexibility by accommodating several different data formats. These include Sawtooth CHO file format, Q experiment question format, an output from Insert > More > Conjoint/Choice Modeling > Experimental Design, Sawtooth Dual file format, and JMP file format. You can both upload your data into Displayr directly or provide data files via URL if they’ve been uploaded to the web.
How to use specific data inputs
First create your R output by clicking More > Conjoint/Choice Modeling > Hierarchical Bayes in the Ribbon at the top. Then look for the control label ‘Data Source’ on the right hand side of the screen and select your data source from the drop down menu. Below I describe what the various data sources are.
i. Data set
The default data source is “Data set”. To use this source, you upload details of your design and the choice experiment results as data sets. My design was specified in an .xlsx file from Excel and the respondent choices and other respondent-specific data were in a .sav file.
Under “EXPERIMENTAL DESIGN” in the object inspector on the right, you will see you need to supply the version number, task number, and attributes of the design as variables. You can do this by typing into each box the name of the required variables in your data set or by dragging variables from your data source tree (on the bottom left hand side of the screen) into their corresponding boxes in the output.
The last piece of the experimental design to specify is the names of the attributes and their levels. This is done by clicking the red box “Enter attribute levels” and typing or pasting in the attribute names and levels. An example of what this should look like is here; the first row contains the attribute names and their attribute levels are entered in the rows below.
The remaining two pieces of input data are under “RESPONDENT DATA”. You supply variables containing the respondent choices in the box next to “Respondent choices”. You need to have one variable for each question asked. Finally, specify the task number seen by each respondent in the box next to “Respondent tasks”. Like respondent choices, you should only have one variable per question.
If your conjoint data comes from Alchemer (formerly SurveyGizmo), you will need to first add both the conjoint and respondent data files as “Data Sets” and go to Insert > More > Conjoint/Choice Modeling > Convert Alchemer (Survey Gizmo) Conjoint Data for Analysis. Displayr will then add the appropriate questions containing the choices and the design version in the respondent data set.
Alternatively, if you would like to conduct a simulation study with synthetic respondent choices, this may be done by changing the Data source under “RESPONDENT CHOICES” to “Simulated choices from priors”. This is described in detail in this blog post.
ii. Experimental Design From Q or Displayr
The second data source option is ‘Experimental design R output’, which refers to an R output from estimating a choice experimental design using Displayr (via More > Conjoint/Choice Modeling > Experimental Design). Once you have selected that data source, select your design from the ‘Design’ drop down menu that appears. Then, provide the choices and tasks made by each respondent as described for the “Data set” data source.
iii. Sawtooth CHO format
The third data source option is ‘Sawtooth CHO format’. To use this option, you will upload your CHO file as a data set as we did for the “Data set” design source option. This will result in you have a text variable in your Data Sets pane on the left of the screen, which you will drag into the box next to “CHO file text variable”. Once that’s done the remaining inputs are the same as described in the “Data set” section above.
iv. Sawtooth dual file format
The fourth data source option is “Sawtooth dual file format as data set”. Use this option if your input data is from Sawtooth, but in dual file format instead of CHO format. You will upload your files in the same manner as for the “Data set” source outlined. Displayr will read in your data files automatically, and then the steps and inputs to the choice model will be the same as described in the “Data set” section.
v. JMP format
The fifth data source option “JMP format as data set”. You should use this if your design was generated and exported from JMP software. It requires the same data inputs as the “Sawtooth dual file format as data set” and “Data set” data source options.
vi. Experiment variable set
The final option is Experiment variable set., which is a special type of variable supported by Q and Displayr for experimental designs. If you have uploaded a data set containing an experiment question, you will be able to select it from the drop down below called ‘Experiment question’.
Other Inputs

You’ll definitely want to pay attention to the following inputs as they are necessary to fine tune your algorithm. With our choice model selected, when we expand the “MODEL” and “ADVANCED” sections inside the object inspector, we see the following inputs.
- Number of classes: Use this option if you’d like to fit a latent class HB choice model. While this option may offer a better picture of reality, its complexity and additional time requirements means that it can be a difficult model to fit and interpret. However, while not all software accommodates this feature, it is offered in Displayr. You may want to see this related post on choosing the number of classes for a Latent Class Analysis.
- Questions left out for cross validation: Use this control to test the out-of-sample prediction performance of your model using cross-validation. If set to a number greater than zero, the specified number of questions will be held out from each respondent during model fitting and later used for prediction purposes. The percentage of correct predictions averaged over all respondents will be displayed in the output.
- Alternative-specific constants: Whether alternative-specific constants are added to the model. They are included by default, in order to capture any alternative-specific bias in respondents.
- Iterations: The number of iterations to run the sampling algorithm for. To ensure accurate estimates of the model parameters, it is important that this number is high enough to make sure the algorithm has converged to the target. A warning is issued if there appears to be any issues with sampling that could be corrected by increasing this number.
- Chains: The number of separate chains to run during sampling. Increasing this number allows us to run separate Markov chains in parallel that each run for the number of iterations. I recommend using multiple chains so you can assess whether your algorithm has converged (more on this later in this post).
Additional inputs and details are discussed on the Q wiki.
Here’s an example in Displayr
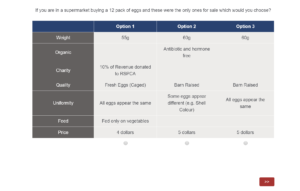
I’ll walk you through the rest of this approach using data from a discrete choice experiment. This experiment investigates consumer preferences when purchasing a 12-pack of chicken eggs from a supermarket. There were 380 respondents and each were asked eight questions. These questions required them to choose three alternative 12-pack of eggs.
The alternatives varied seven attributes with multiple levels for each:
- egg weight (55g, 60g, 65g, or 70g)
- egg quality (caged, barn, or free range)
- price ($2, $3, $4, $5, or $6)
- chicken feed used (not stated, grain and fish, or vegetables only)
- egg uniformity (all eggs the same or some different)
- whether the eggs were organic (not stated or antibiotic and hormone free)
- whether any proceeds from the sale went to charity (not stated or 10% donated to RSPCA)
An example questions shown to respondents is below:
How to check your model is accurate (convergence)
Checking that the sampling algorithm has converged is a crucial step in any HB analysis. For your analysis to be accurate, your samples must be drawn from the target distribution and adequately represent the entire target distribution. This is so you can see the full picture of our customer’s decision making process rather than only getting a partial and inaccurate view.
The algorithm starts by drawing samples from a random point while aiming to get closer to convergence. Once it has finished, you need to check that convergence has actually occurred.
You might be tempted to run fewer iterations because your analysis will run faster but be warned that you run the risk of your algorithm not converging. I fit the choice model using 150 iterations and six Markov chains. I’ve deliberately run too few iterations to show you what will happen.
Some of the standard deviation parameters have Rhat values greater than 1.1. Ideally, we would like these values to be closer to 1.0. These parameters also have fairly low effective sample sizes (n_eff). This means that we didn’t run the algorithm long enough to obtain enough information about these parameters. Therefore, we should rerun the analysis with more iterations. This post introduces the diagnostics in more detail.
This analysis showed us that the egg quality and price covariates appear to have by far the largest impact on egg choice. But we would have to confirm this by running more iterations.
A final tip
Finally, I’ll mention one additional helpful way of assessing the performance of our models. If we leave out one or more questions answered by each respondent during model fitting, we can assess how well our model performs at predicting their choices. You can do this via the “Questions left out for cross validation” input mentioned above.
See this post for details on how to include fixed covariates and demographic variables in the model. If you’d like to see how to conduct a MaxDiff analysis using HB, see this post.
Don’t forget to subscribe to the blog for more data science and market research tips and tricks.
