

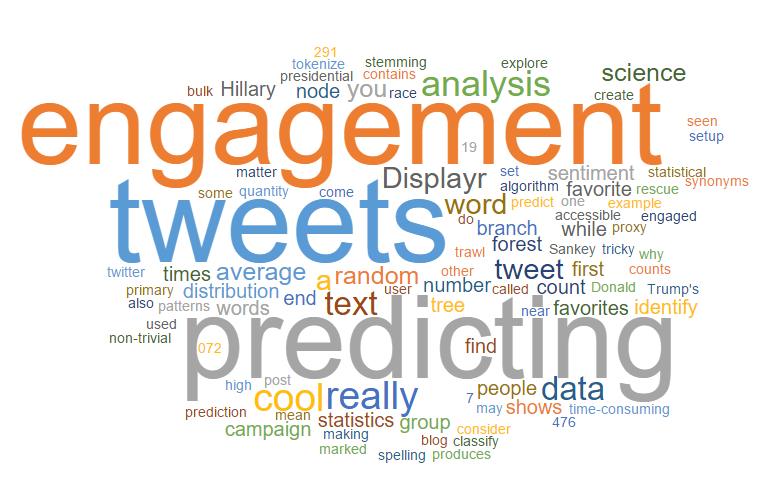
Why do some tweets sizzle while others fizzle? This is a key question that predictive text analytics can help answer. By leveraging advanced algorithms and statistical techniques, predictive text analytics can identify patterns in text data that predict engagement levels, sentiment, and other crucial metrics.
As an example, we consider a set of Donald Trump’s tweets from the end of the presidential primary race. You can explore this example for yourself in Displayr. The Twitter (or X) data set contains a count of the number of times each tweet was marked as a favorite by a user. This can be used as a proxy for how engaged people were with the tweets. The average number of favorites for the tweets in this data set was 19,072.7. The distribution of the favorites shows the bulk of the tweets near the mean, but also a non-trivial number with very high favorite counts (one has 291,476 favorites!).
Explore the original dashboard
Using Predictive Text Analytics to Create a Sankey Tree
Using predictive text analytics, a predictive tree applied to the words in the text of the tweets lets us see which words are associated with higher levels of engagement. In Displayr, a predictive tree for analyzing text is created by:
- Selecting Insert > More > Text Analysis > Setup Text Analysis to choose which words to keep in the analysis. The setup of the text analysis is discussed more in How to set up your text analysis in Displayr.
- Selecting Insert > More > Text Analysis > Techniques > Predictive Tree.
This produces a diagram called a Sankey tree. It shows us which words in the text indicate higher or lower levels of engagement. Each branch of the tree represents a group of tweets, and they are grouped by the presence of a particular word in the text. The end of the branch shows the average number of favorites among those tweets. If you hover your mouse over a node, it will tell you more information about the distribution of favorites for that group of tweets. You can explore this example yourself in Displayr.
If we focus on broad themes, we find the following:
- Mentions of Hillary Clinton tended to generate higher levels of engagement than average. As you might expect, the tone of these was very often negative.
- Retweets of other people’s statements (which usually include the reference @realDonaldTrump) tended to do significantly worse than average.
- The most frequent hashtag, #trump2016, also generated lower engagement. Use of this hashtag seems like deliberate messaging by Trump’s media team, and it has not been very successful at generating engagement.
- Mention of the word people also generated higher engagement (more on this below).
How Predictive Text Analytics Reveals Small Words with High Impact
When creating the example above, we only kept the words which occurred in the tweets most frequently. Any words which appeared less than 100 times were removed from the analysis before creating the tree. By including words which are less frequent we can identify small groups of tweets that really tickled the twitterverse. Here is the tree that is produced when we keep most words in:
In this tree, all of the branches that contain the most significant splits of tweets are very narrow. They identify low-frequency, high-impact themes. At the top of the tree, we find that the branch containing tweets that refer to Hillary Clinton (a branch that was contained in the first tree) is now further split by the word spending. Those tweets that talk about Hillary’s campaign spending have an average favorite count, which is more than three times the sample average. Observing the detail for this node (by hovering) we find that a single, high-impact tweet has dragged up the whole group.
Analyze your own text.
Start a free trial of Displayr.
Understanding the context
In the first example, we saw that tweets featuring the word people had a higher-than-average score. But this word is fairly generic by itself – why should the word people tend to make for a more engaging tweet?
To work out the context, we can create a table showing all of the words that match a certain term. Such a table is added in Displayr using Insert > More > Text Analysis > Techniques > Search, and hooking up the item to a text variable, or one of the text analysis setup items that we used to generate the trees. Here’s the search for the word people:
The table shows us the original text and the result of the processing. Remember, we chose to remove most infrequent words, and so there is not a lot of text remaining.
In the first few entries, we find attacks on the media, and attacks on Hillary – the standard Trump fare. Most importantly, we see Trump reflecting what “the people” think, or what “the people” want. When he mentions “the people”, he is using code for the people in the demographic base that he was targeting with his campaign messaging. So while the word people is not interesting by itself, its value is as a signal. You can use similar investigations to dig down into the infrequent words in the second example.
TRY IT OUT
You can investigate this data set further or even apply predictive text analytics to your own data using the example project in Displayr.
For a more comprehensive look at extracting meaning from text, try Displayr’s text analytics tool for free today.