


SurveyMonkey is the world’s largest online survey tool. They help millions of users create and publish online surveys in minutes. While creating and sharing surveys is a breeze in SurveyMonkey, it can be a real pain to use it to analyze your survey data.
Fortunately, Displayr has teamed up with SurveyMonkey to bring you the very best in powerful statistical analysis and automated survey reporting! With the right tools, anybody can find the story in their data – and this collaboration is exactly the right tool!
You can import your data directly from SurveyMonkey by clicking New Dataset in Displayr. This means you can start analyzing your data right away without needing to go through any other steps.
With the joint capabilities of SurveyMonkey and Displayr, you will be able to dig deeper into your data and share the insights you’ve uncovered from your survey responses. You can build automated reports, create charts and tables, and perform advanced statistical analysis – all for free.
Easily import your SurveyMonkey surveys into Displayr
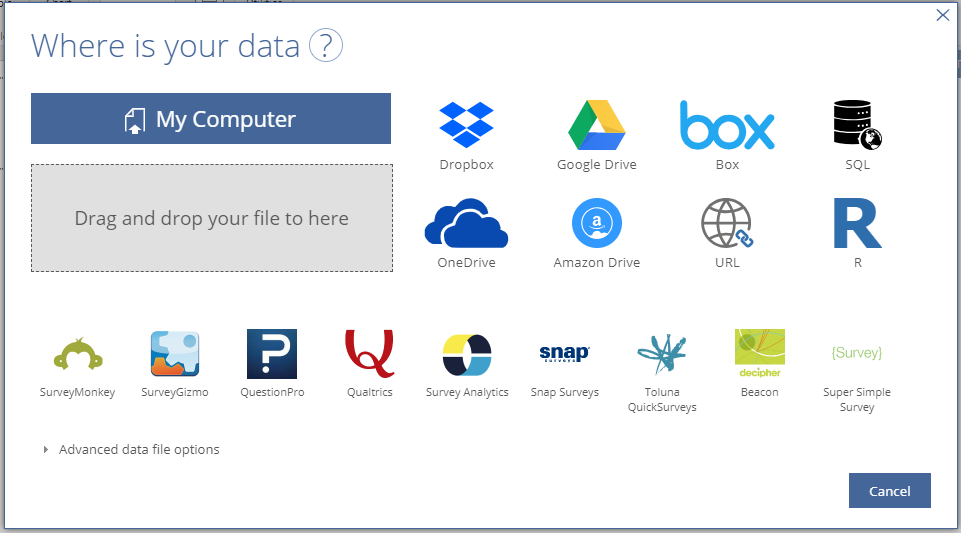
You can import your data directly from SurveyMonkey by clicking New Dataset in Displayr. This means you can start analyzing your data right away without needing to go through any other steps.
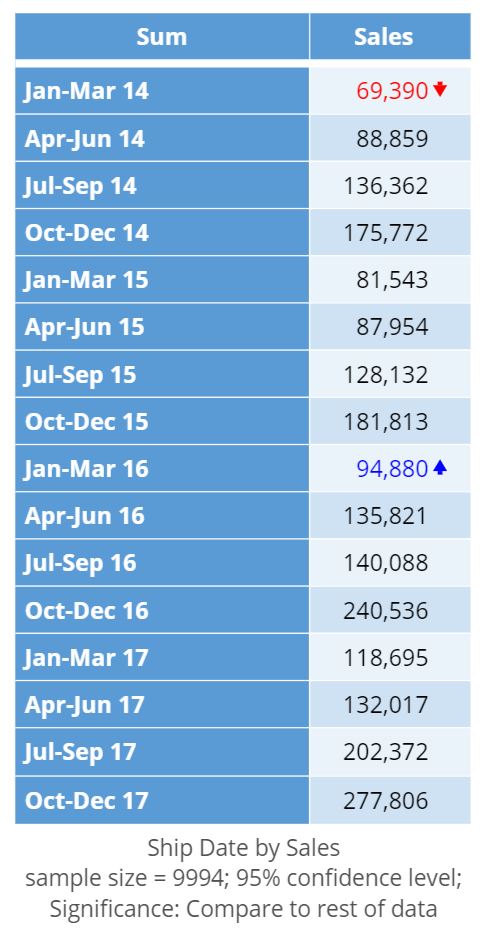
Identify statistically interesting results
Displayr automatically highlights significant results in tables and charts with colors and arrows, meaning you can see what’s going on at a glance.
Visualize your data
Displayr has a wide range of tables and charts that you can use to display your data. Best of all, they are all completely customizable. These include classics such as pie charts, bar charts, and line charts, as well as some you’ve probably never heard of, like palm tree charts or moonplots! You can also create custom word clouds, which are a great way to visualize data from open-ended survey questions.

So what are you waiting for? Click the button below to start analyzing your survey data!
