
What is Data Filtering?

Data filtering explained Data filtering is the process of choosing a smaller part of your data set and using that subset for viewing or analysis. Filtering is generally (but not always) temporary – the complete data set is kept, but only part of it is used for the calculation. Filtering may be used to: Look […]
Easy Functions for Automating Filters and Rebasing

This blog post will take you through the automated tools for filtering and rebasing when analyzing survey data. We have already covered how to create and apply filters using Displayr’s built-in functions and code. See, for example, 5 Ways to Create a Filter in Displayr, How to Filter Data in Displayr and How to Use Basic […]
How to Filter Rows and Columns in Visualizations and Tables without Code

In Displayr you can manipulate rows and columns directly in any Visualization or Paste/Enter Table output created via the Insert menu. This allows you to choose what table dimensions should be included in the final output without having to make changes to the source table. If you wish to display a table instead, referencing your […]
Learn More about Filtering in Displayr

Introduction What is Data Filtering? What is Rebasing? 5 Things to Consider Before Building Your Dashboard Variables and Questions 5 Ways to Create a Filter in Displayr How to Filter Data in Displayr How to Use Basic R Code for Creating Filters Easy Functions for Automating Filters and Rebasing Filters in Displayr Managing Filters and Weights 10 Ways to Create […]
Using Controls to Determine when to Show Outputs
Example In the example below, the combo box says Hide Comments. If you click on it and change it to Show Comments a comment appears. How it works There are three stages to doing this: Adding a control to the page Creating the content you wish to show. Hooking the content up to the control. 1. Adding a […]
How to Automatically Export Multiple Reports with Different Filters

When sharing reports, it’s often necessary to create multiple reports with a different filter on the data. For example, you need a hard copy report for each market or segment. If you’re exporting one report at a time and manually changing the filter, this process can be tedious and time-consuming. In Displayr, you can now […]
How to Dynamically Change a Question Based on a Control Box

The two main types of control boxes are the combo and the list box. Typically they are used for changing how the data is filtered, as discussed in this post. But you can also use a control box to change the actual question in a table (or chart, visualization, etc.). You can also use control […]
How to Connect Filters to a Combo Box (Control)

With Displayr, you can show different patterns in your data by applying filters to analyses. One way to do this is by creating filters that connect directly to a control box on an online dashboard. Combo box, list box, text box and date controls are available, but in this blog post, I will manually create […]
Allowing Users to Filter Pages in Dashboards
This post describes how to set up documents to permit Displayr users to filter pages in an online document (i.e., dashboard). The user experience When a user accesses Displayr in View Mode, the top-right of the screen shows a standard set of controls. These allow searching, filtering, exporting, zooming, and getting a full screen display. […]
Filtering a Subset of Tables and Visualizations on a Page in Displayr
When you are working in Displayr’s edit mode, you can choose which items on a page to filter by selecting the items and applying a filter. When people view your published document (view mode) and apply a filter to a page, the default behavior is that all the things on the page are filtered. Sometimes you may […]
Adding a Combo Box to a Displayr Dashboard
A combo box can be added to a Displayr document by selecting Insert > Control (More), which causes a combo box to appear in the middle of the screen. The control allows the user to make one or more choices from a list of options. You can then use these choices as inputs into calculations. Settings When you […]
5 Ways to Create a Filter in Displayr

This blog shows how to create a filter. Before reading this blog, make sure you check out Using Displayr to filter data, analyses, and whole reports, which describes what filters can do in Displayr. 1. Creating simple filters from the ribbon The simplest way to create a filter is to select Insert > Variables […]
Using Displayr to Filter Data, Analyses, and Whole Reports
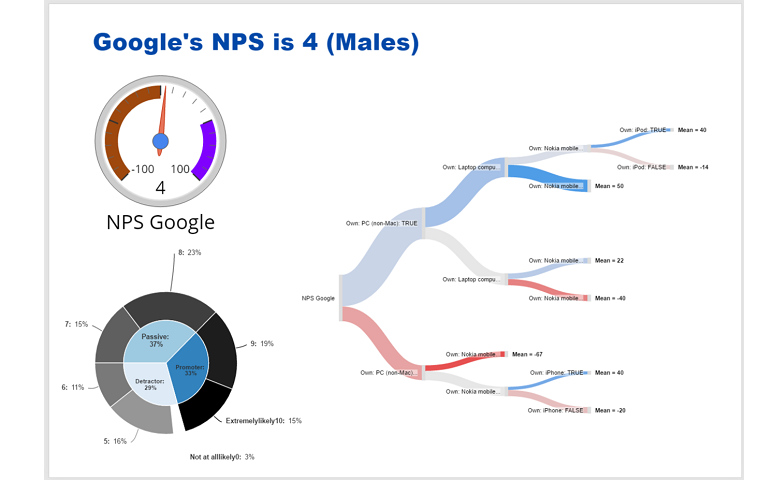
Displayr’s approach to filtering is uniquely powerful. Filters can be applied to tables, charts, complex visualizations, advanced analyses, and text (with a bit of care). You can even filter an entire report, which means that filters are great when implementing automated reporting. Example: Filtering Google NPS Data Net Promoter Score (NPS) is a metric for evaluating the […]