
Ranking Plot.
Ranking Plots: Illustrating Data with Different Magnitudes
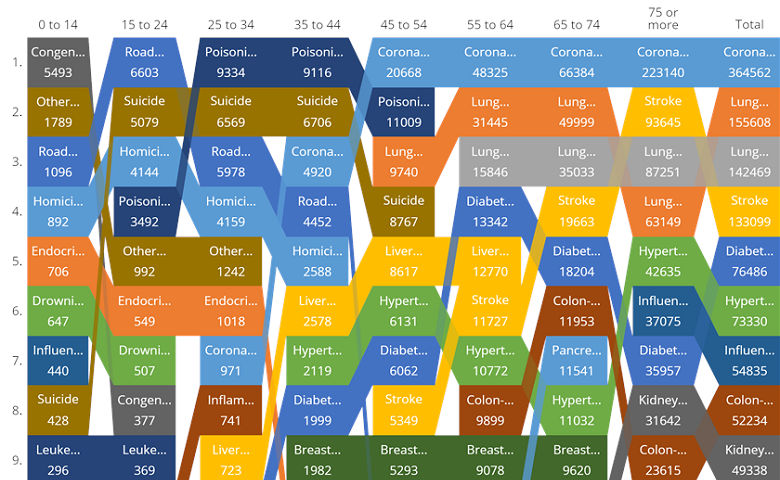
The Ranking Plot, also known as rank flow plots, are particularly useful when comparing data that is complex or that differs in magnitude.
Continue reading
How to Create a Bump Chart (Ranking Plot) from a Table Using Displayr
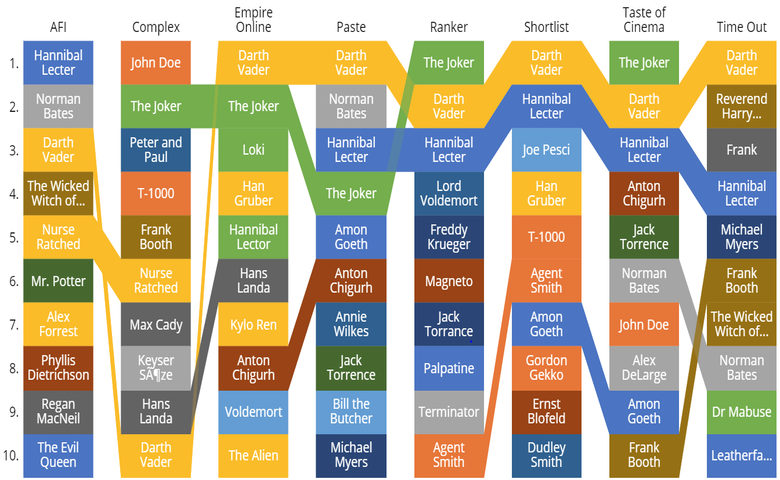
Bump charts, also known as ranking plots are a great way to compare rankings from different groups. I'll show you how to easily create one in Displayr.
Continue reading