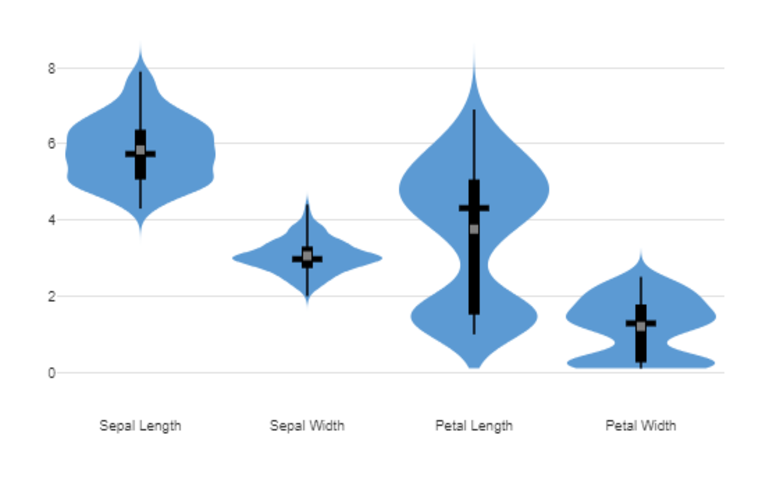
violin plot.

How to Create a Violin Plot in Displayr
Violin plots combine features of density and box plots to show the distribution shape as well as the median and interquartile range.
Continue reading
